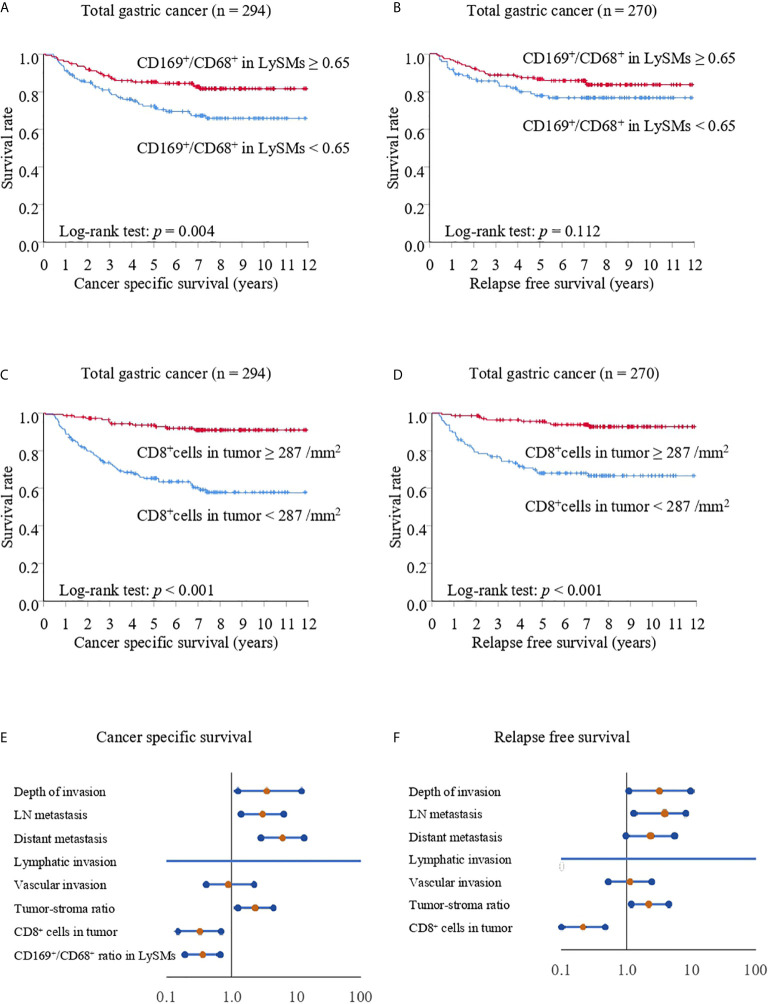
Figure 3.
Kaplan-Meier cancer-specific survival and relapse-free survival curves for total gastric cancer cases. The patients were divided into two groups according to their CD169/CD68 ratio: < 0.65 was defined as low and ≥ 0.65 was defined as high (A, B) or divided into two groups according to their density of CD8+ cells: < 287/mm2 was defined as low and ≥ 287/mm2 was defined as high (C, D). (A, C) Cancer-specific survival (CSS) curves for patients with total gastric cancer. (B, D) Relapse-free survival (RFS) curves for patients with total gastric cancer. (E) Forest plot analysis of CSS. (F) Forest plot analysis of RFS.

