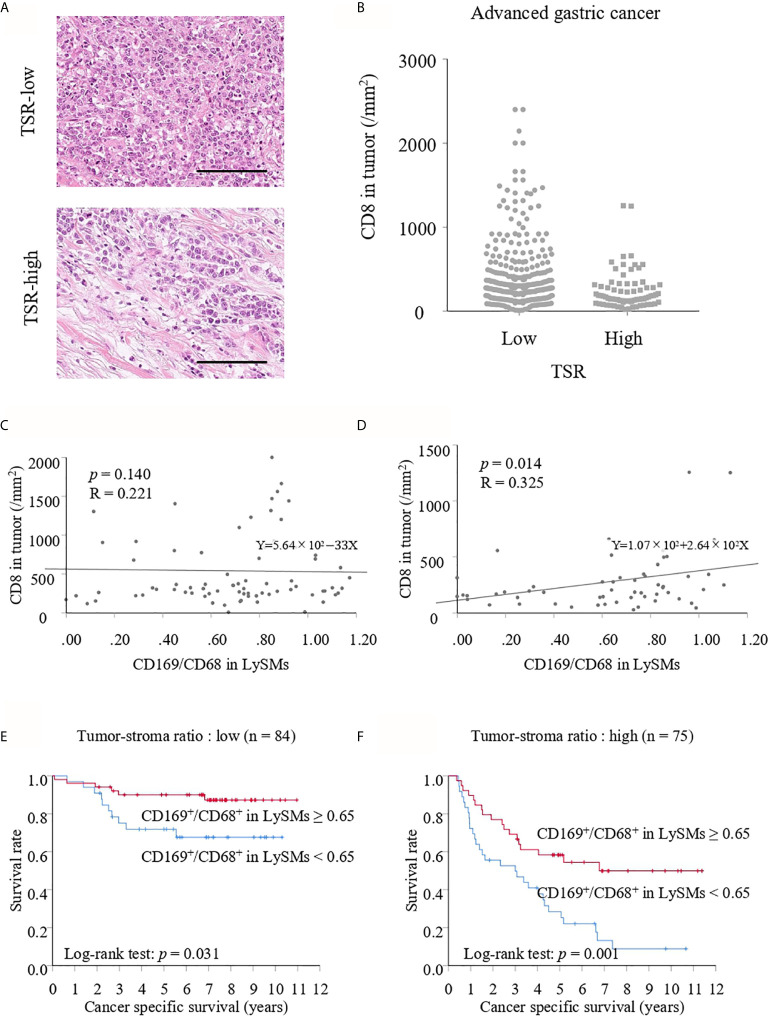
Figure 7.
(A) Hematoxylin and eosin staining of tumor-stroma ratio (TSR)- low and high. Scale bar = 100 μm. (B) Number of CD8+ T cells in TSR-low or high advanced cancer tissues. Correlation between the number of CD8+ T cells in TSR-low or high tumor tissues and the CD169/CD68 ratio in lymph node sinus macrophages (LySMs) were tested by Spearman’s correlation test. Scatter plot in TSR-low advanced gastric cancer cases (C) and in TSR-high advanced gastric cancer cases (D) were shown. (E) Kaplan-Meier cancer-specific survival (CSS) curves in patients with TSR-low advanced gastric cancer. (F) Kaplan-Meier CSS curves in patients with TSR-high advanced gastric cancer.

