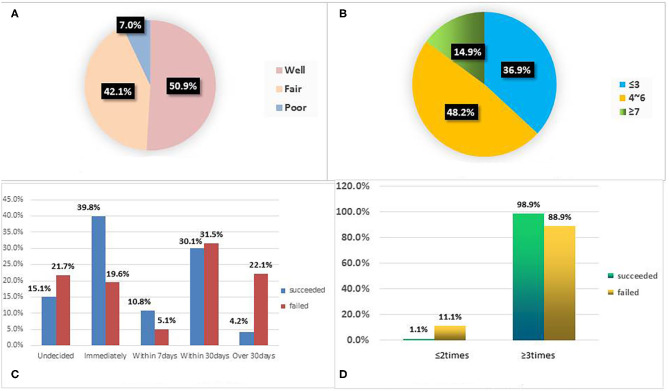
Figure 1.
(A) Health assessment represents the proportion of the subjective assessment of physical condition grade of 328 patients; (B) Fagerstrom score represents the proportion of Fagerstrom Test for Nicotine dependence among 328 patients. (C) Date of SC represents the proportional distribution characteristics of the expected start time of smoking cessation between the successful and unsuccessful smoking cessation groups; (D) Follow ups represents the proportional distribution characteristics of the number of follow-up visits between the successful group and the failed group. SC, smoking cessation.

