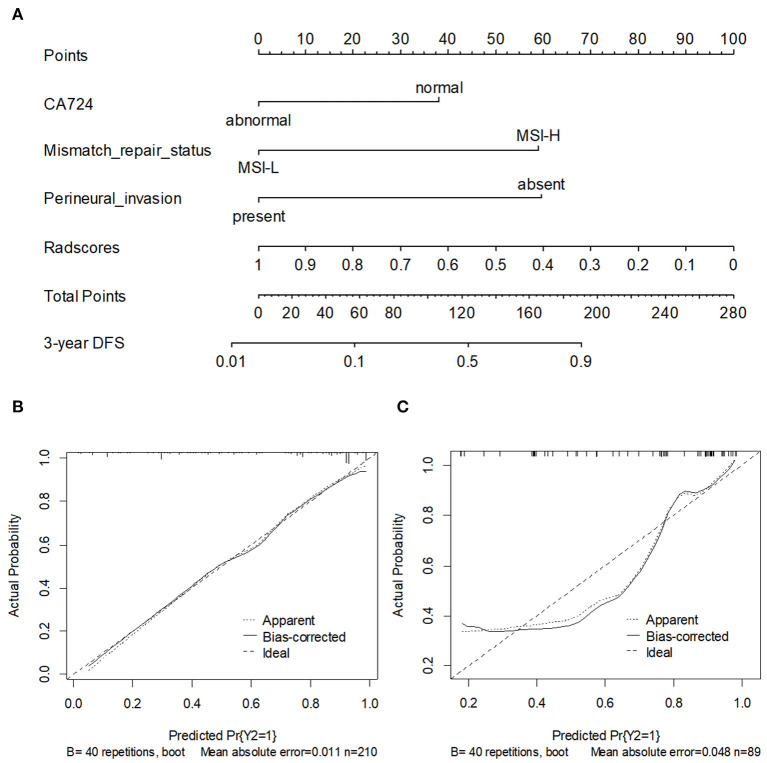
Figure 6.
(A) A nomogram for 3-year DFS was developed in the training data set with clinicopathological characteristics. Calibration curves of the nomogram in training cohort (B) and validation cohort. (C) Model performance is shown by the plot, relative to the 45-degree line, which represents perfect prediction.

