Figure 2.
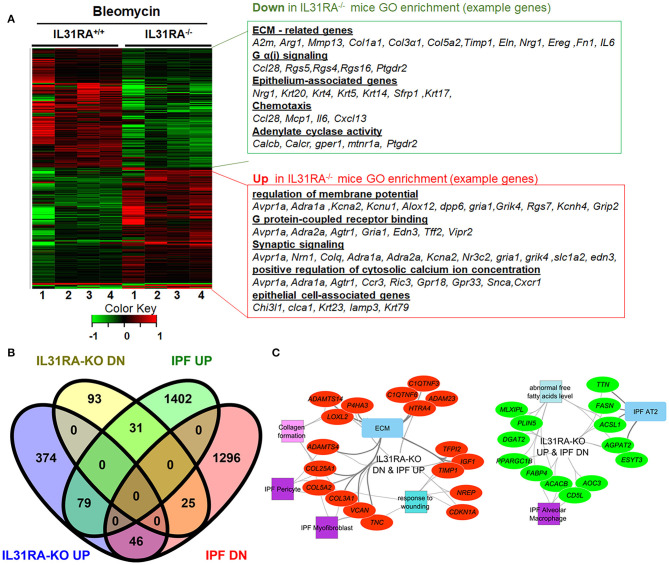
The IL-31-IL-31RA axis regulated gene networks during bleomycin-induced pulmonary fibrosis and IPF. Total lung RNA was isolated from bleomycin or saline-treated mice and performed RNA-seq analysis. (A) The heat map shows two clusters of differentially expressed genes that were up-or down-regulated by at least 1.5-fold upon bleomycin treatment of genetic knockdown of IL-31RA compared to wildtype mice. Gene Ontology Enrichment analysis for IL-31RA-dependent gene transcripts was performed using ToppFun. (B) Venn diagram of IL31RA-regulated genes compared with differentially expressed lung transcripts of IPF patients. (C) IL-31RA-driven gene networks that are activated in IPF were analyzed using ToppFun and visualized using Cytoscape. Red- and green-colored oval shapes represent genes that are IL31RA-regulated and up-or down-regulated, respectively in IPF lungs. Both square and rectangle shapes represent different enriched biological processes and cell types for the inversely correlated genes between the IL-31-IL-31RA axis and IPF.

