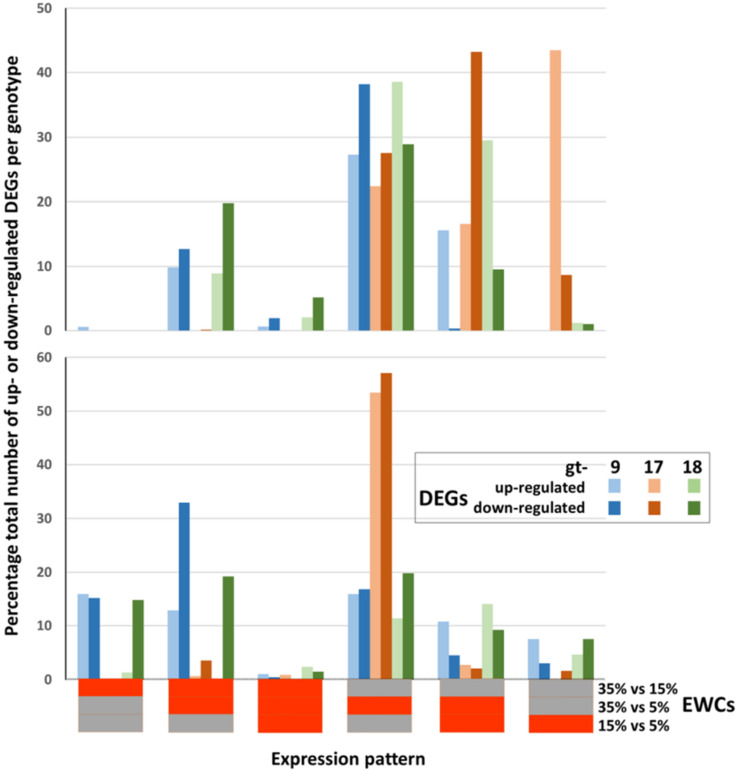
FIGURE 2.
Relative proportions of differentially expressed genes (DEGs) contributing to the enrichment of GO terms across genotypes (gt-) 9, 17, and 18 and combined estimated water content (EWC) comparison points (expression patterns). The percentage proportions of up- and down-regulated DEGs identified for each individual expression pattern are indicated by the colored columns. Horizontal bars beneath the x axis indicate the individual EWC comparison points (indicated at the end of the x axis) in which the genes were differentially expressed for each expression pattern; red = differentially expressed for that EWC comparison point; gray = not differentially expressed for that EWC comparison point. E.g., the first expression pattern indicates the percentage proportion of the total number of up- and down-regulated DEGs for each genotype that were differentially expressed for the 35% vs. 15% comparison point (red) but were not differentially expressed for the 35% vs. 5% and 15% vs. 5% comparison points (gray).

