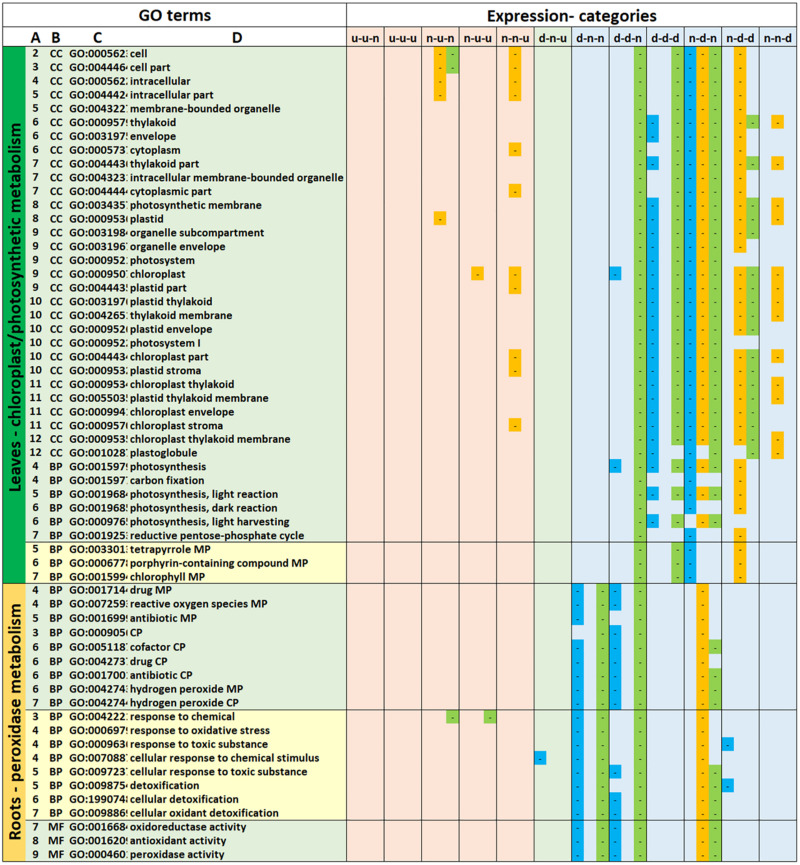
FIGURE 3.
GO terms identified in all three genotypes relating to photosynthetic metabolism in the leaves and peroxide and cellular detoxification processes in the root. GO Terms (A) relative positions of GO terms linked through hierarchies visualized at https://www.ebi.ac.uk/QuickGO/slimming. (B) GO category, BP, biological process; CC, cell compartment; MF, molecular function. (C) GO description (1MP, metabolic process; 2CP, catabolic process). Expression Categories: Expression patterns of differentially expressed genes contributing to enrichment of GO terms. d, down-regulated; u, up-regulated; n, not significantly down- or up-regulated; x-y-z, d, u, or n relating to the 35/15 (x), 35/5 (y), and 15/5 (z) sampling point comparisons. The first column for each expression category indicates whether a GO term(s) was significantly enriched for gt-9 (blue), the second column for gt-17 (orange) and the third for gt-18 (green).

