
Figure 2:
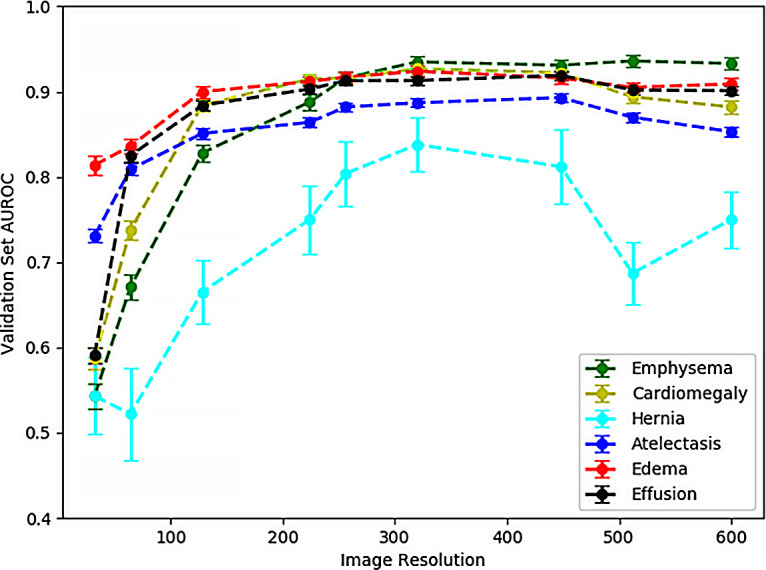
Validation set area under the receiver operating characteristic curve (AUROC) for six different diagnostic labels shows improved performance with increased image resolution and a plateau effect on performance improvement for resolutions higher than 224 × 224 pixels. Models were trained with ResNet34 architecture for three subsample epochs. Resolutions shown are as follows: 32 × 32, 64 × 64, 128 × 128, 224 × 224, 256 × 256, 320 × 320, 448 × 448, 512 × 512, and 600 × 600 pixels. Error bars represent standard deviation of the area under the curve calculated via the DeLong method.