
Figure 3:
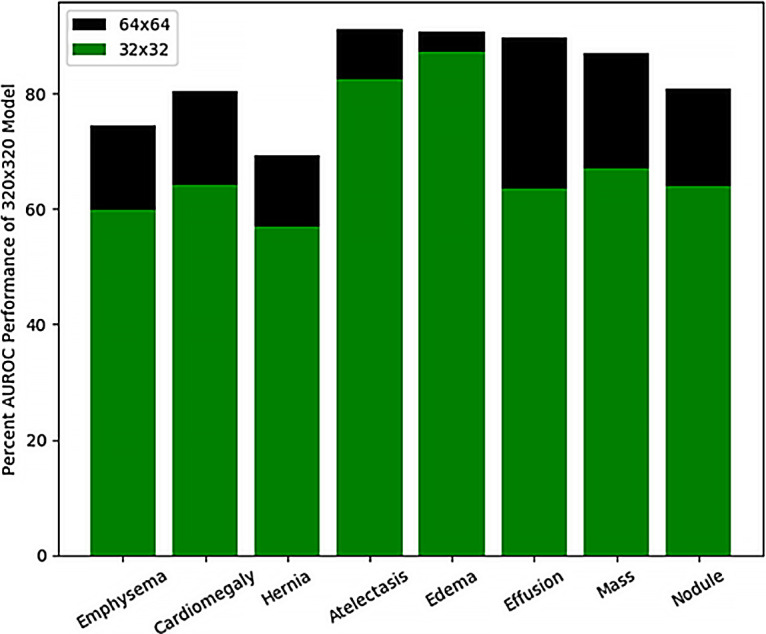
Bar graph shows percentage area under the receiver operating characteristic curve (AUROC) achievable with low-resolution models compared with a higher resolution 320 × 320-pixel resolution model for eight example diagnostic labels. Edema prediction models at 32 × 32-pixel resolution are able to capture the highest percentage of a 320 × 320-pixel resolution model.