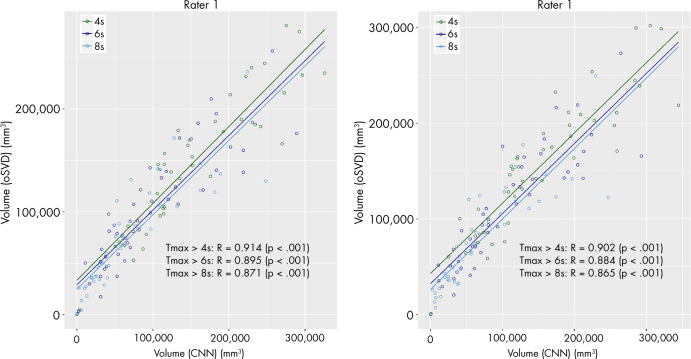
Figure 2:
Scatterplots of estimated volumes derived from time to maximum of tissue residue function (Tmax) maps of the convolutional neural network (CNN) and oscillation index singular value decomposition (oSVD) methods for both raters. Correlation is reported in terms of Pearson R. The different colors indicate different thresholds for Tmax values.

