
Table 3:
Dice Coefficients for Increasing Thresholds of Tmax Values between Annotations Based on oSVD- and CNN-derived Tmax Perfusion Maps for Both Raters
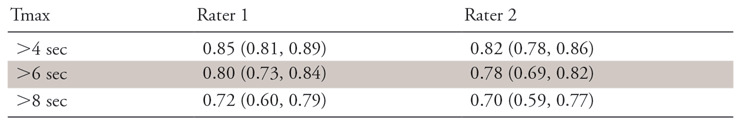
Note.—Data are medians with interquartile ranges in parentheses. CNN = convolutional neural network, oSVD = oscillation index singular value decomposition, Tmax = time to maximum of the tissue residue function.