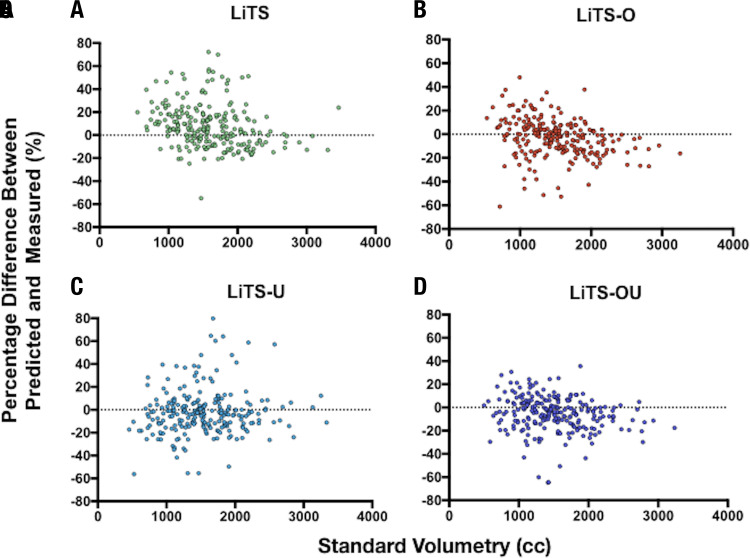
Figure 4:
Bland-Altman plots across active learning training models. Bland-Altman analysis was calculated across all training models on the Mount Sinai Health System test set (n = 239) and excluded any training images. For, A, Liver Tumor Segmentation (LiTS), B, LiTS plus overestimated active learning cases trained (LiTS-O), C, LiTS plus underestimated active learning cases trained (LiTS-U), and, D, LiTS plus over- and underestimated active learning cases trained (LiTS-OU) datasets, intraclass correlation was 0.81 (95% confidence interval [CI]: 0.74, 0.86), 0.87 (95% CI: 0.82, 0.90), 0.83 (95% CI: 0.78, 0.86), and 0.88 (95% CI: 0.82, 0.92), respectively. cc = milliliters.

