
Figure 4:
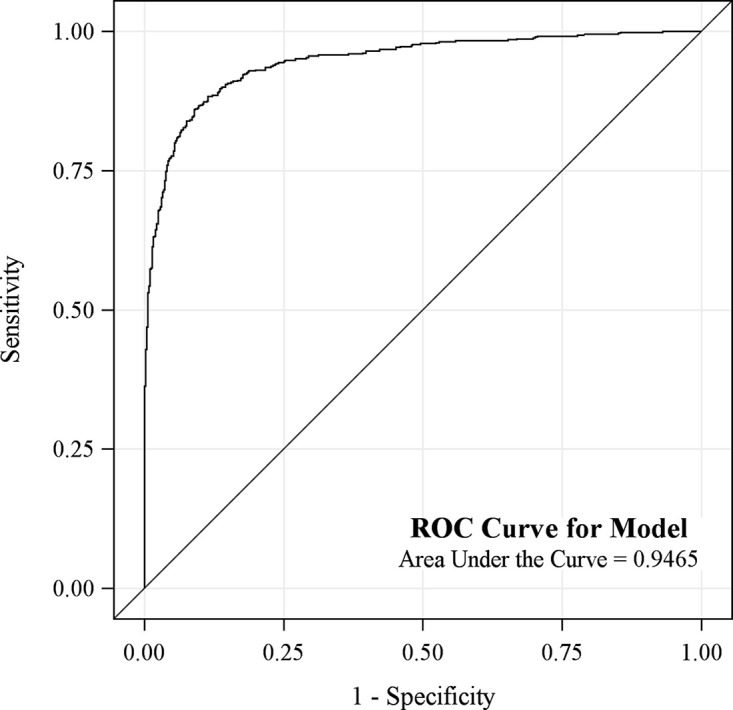
Graph shows area under the receiver operating characteristic (ROC) curve for the model was 0.95 (95% confidence interval: 0.93, 0.960).
Official websites use .gov
A
.gov website belongs to an official
government organization in the United States.
Secure .gov websites use HTTPS
A lock (
) or https:// means you've safely
connected to the .gov website. Share sensitive
information only on official, secure websites.
Graph shows area under the receiver operating characteristic (ROC) curve for the model was 0.95 (95% confidence interval: 0.93, 0.960).