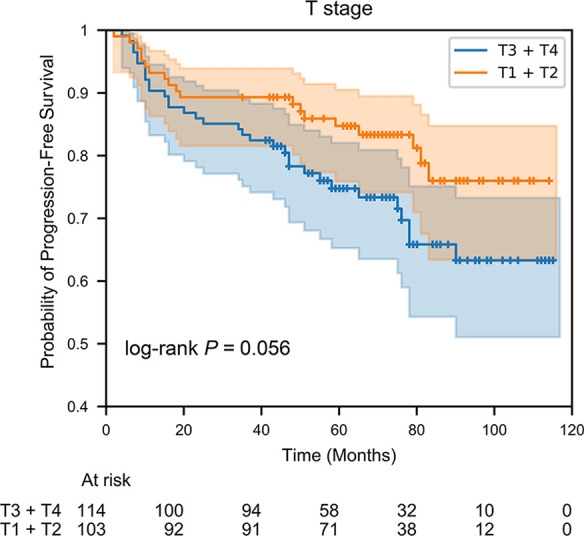
Figure 3b:

Kaplan-Meier plots of features that are associated with progression-free survival. Log-rank P value and risk table are given in each plot. (a) Overall stage. (b) T stage. (c) Shape sphericity. (d) Contrast-enhanced T1-weighted low-low band wavelet transforms gray level run length matrix gray level nonuniformity normalized. (e) Contrast-enhanced T1-weighted first-order mean absolute deviation. (f) Contrast-enhanced T1-weighted low-low band wavelet transforms gray level co-occurrence matrix sum entropy.
