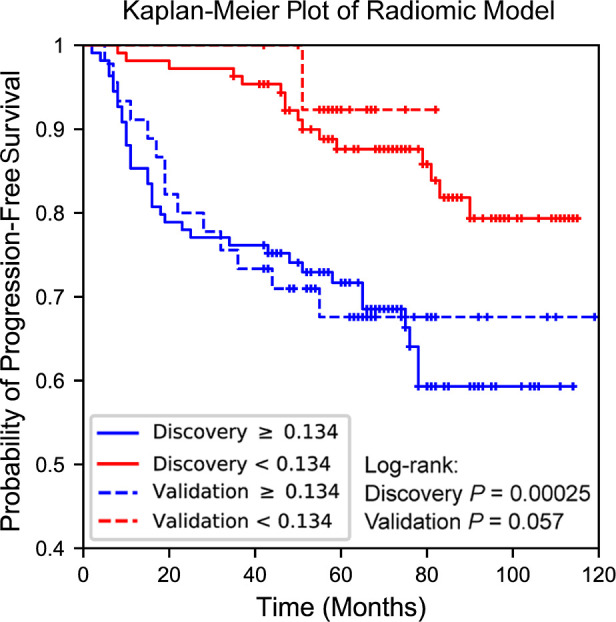
Figure 4a:

Performance of the radiomic model. (a) Kaplan-Meier plot of the radiomic model. Survival group for both the discovery cohort and the validation cohort is given. The median output probability of the discovery cohort was used as the threshold for separation of groups for both discovery and validation cohorts. (b) Receiver operating characteristic (ROC) curve of discovery and validation cohort. Optimal decision threshold was selected by the maximum Youden index of the ROC of the discovery cohort. AUC = area under the ROC curve.
