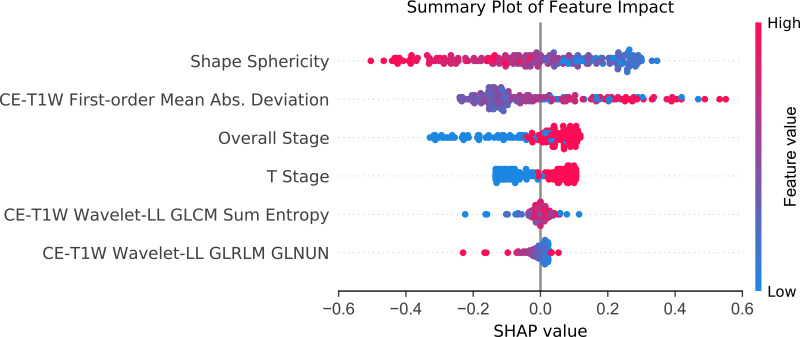
Figure 5:
Summary plot of feature impact on the decision of the radiomic model and interaction between features in the model. A positive Shapley additive explanations (SHAP) value indicates an increase in risk and vice versa. For overall stage and T stage, the high value corresponds to stage III + IV and T3 + T4 groups. Each point corresponds to a prediction in a patient. CE-T1W = contrast-enhanced T1-weighted, GLCM = gray level co-occurrence matrix, GLNUN = gray level nonuniformity normalized, GLRLM = gray level run length matrix, wavelet-LL = low-low band wavelet transforms.

