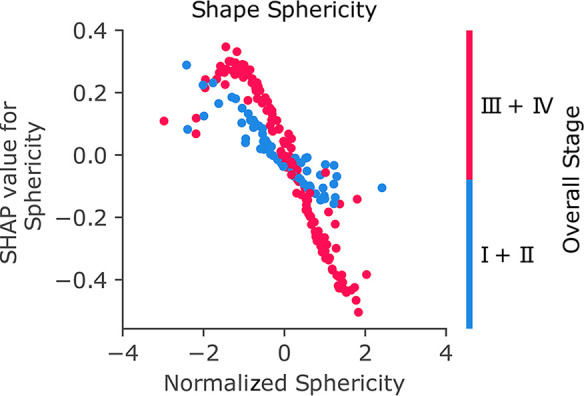
Figure 6a:

Shapley additive explanations (SHAP) dependence plot of the features in the model. Each point on the plot corresponds to a prediction in a patient. (a) Dependence plot of shape sphericity shows how SHAP values vary with varying sphericity and the interaction with overall staging. (b) Dependence plot shows how SHAP values vary with contrast-enhanced T1-weighted first-order mean absolute deviation and the interaction with overall staging. (c) Dependence plot shows how SHAP values vary with overall staging and the interaction with shape sphericity. (d) Dependence plot shows how SHAP values vary with overall staging and the interaction with contrast-enhanced T1-weighted first-order mean absolute deviation.
