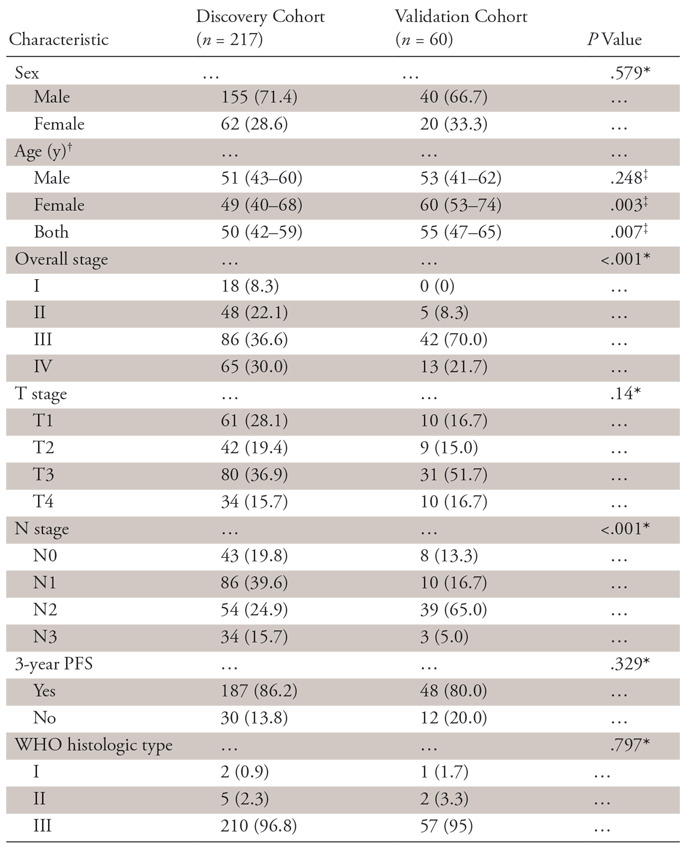
Table 1:
Summary of Patient Characteristics in Both Cohorts

Note.—Unless otherwise indicated, data are numbers of patients, and data in parentheses are percentages. PFS = progression-free survival, WHO = World Health Organization.
*P value was determined with the Pearson contingency χ2 test. P > .05 suggests no significant difference between the proportion of subjects in the two cohorts.
†Data in parentheses are the interquartile range.
‡P value was determined with the independent samples t test. P < .05 suggests a significant difference between the age in the two cohorts.
