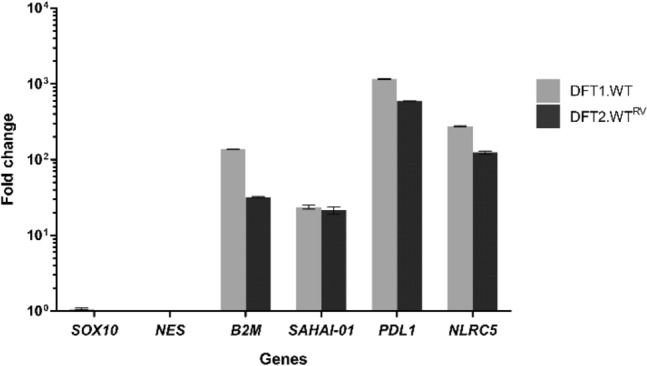
Fig. 1.

Upregulation of NLRC5 by IFNG in DFT1 and DFT2 cells. Fold change in mRNA expression (transcripts per kilobase million (TPM)) of B2M, MHC class I gene SAHAI-01, PDL1 and NLRC5 upon IFNG treatment in DFT1 C5065 cell line (DFT1.WT) and DFT2 RV cell line (DFT2.WTRV). SOX10 and NES were included as internal controls. Bars show the mean of N = 2 replicates per treatment. Error bars indicate standard deviation
