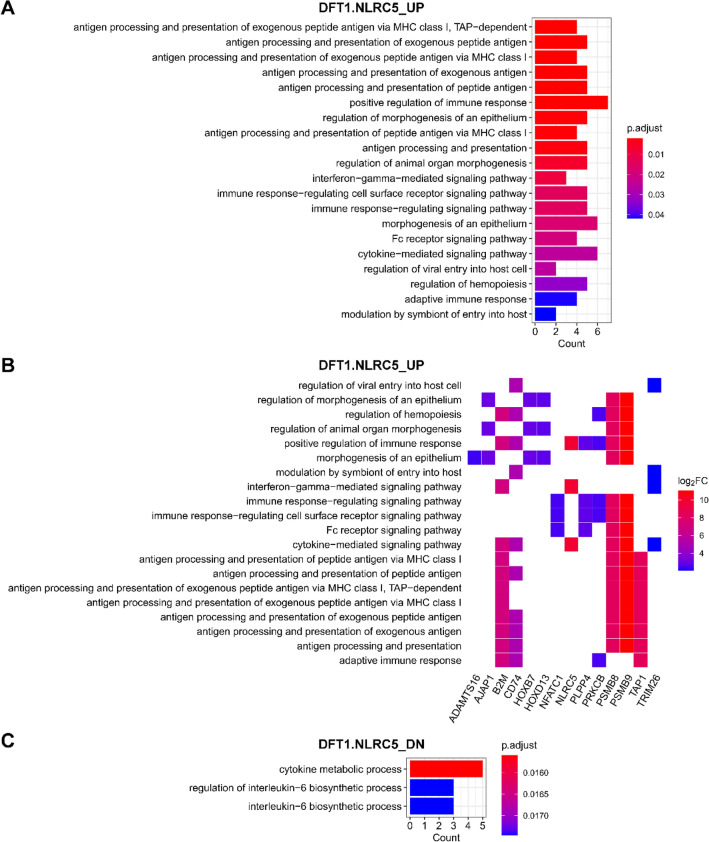
Fig. 4.
GO biological processes that were enriched in DFT1 cells with NLRC5 overexpression. GO biological process terms associated with genes upregulated (UP) (a, b) and downregulated (DN) (c) in DFT1.NLRC5. b Heatplot of genes associated with each positively regulated GO term. The cut-offs p-value < 0.001 and adjusted p-value (p. adjust) < 0.05 were used to determine significant biological processes. P values were adjusted for multiple testing using Benjamini–Hochberg method. See also Online Resource 12 for full list of GO biological processes

