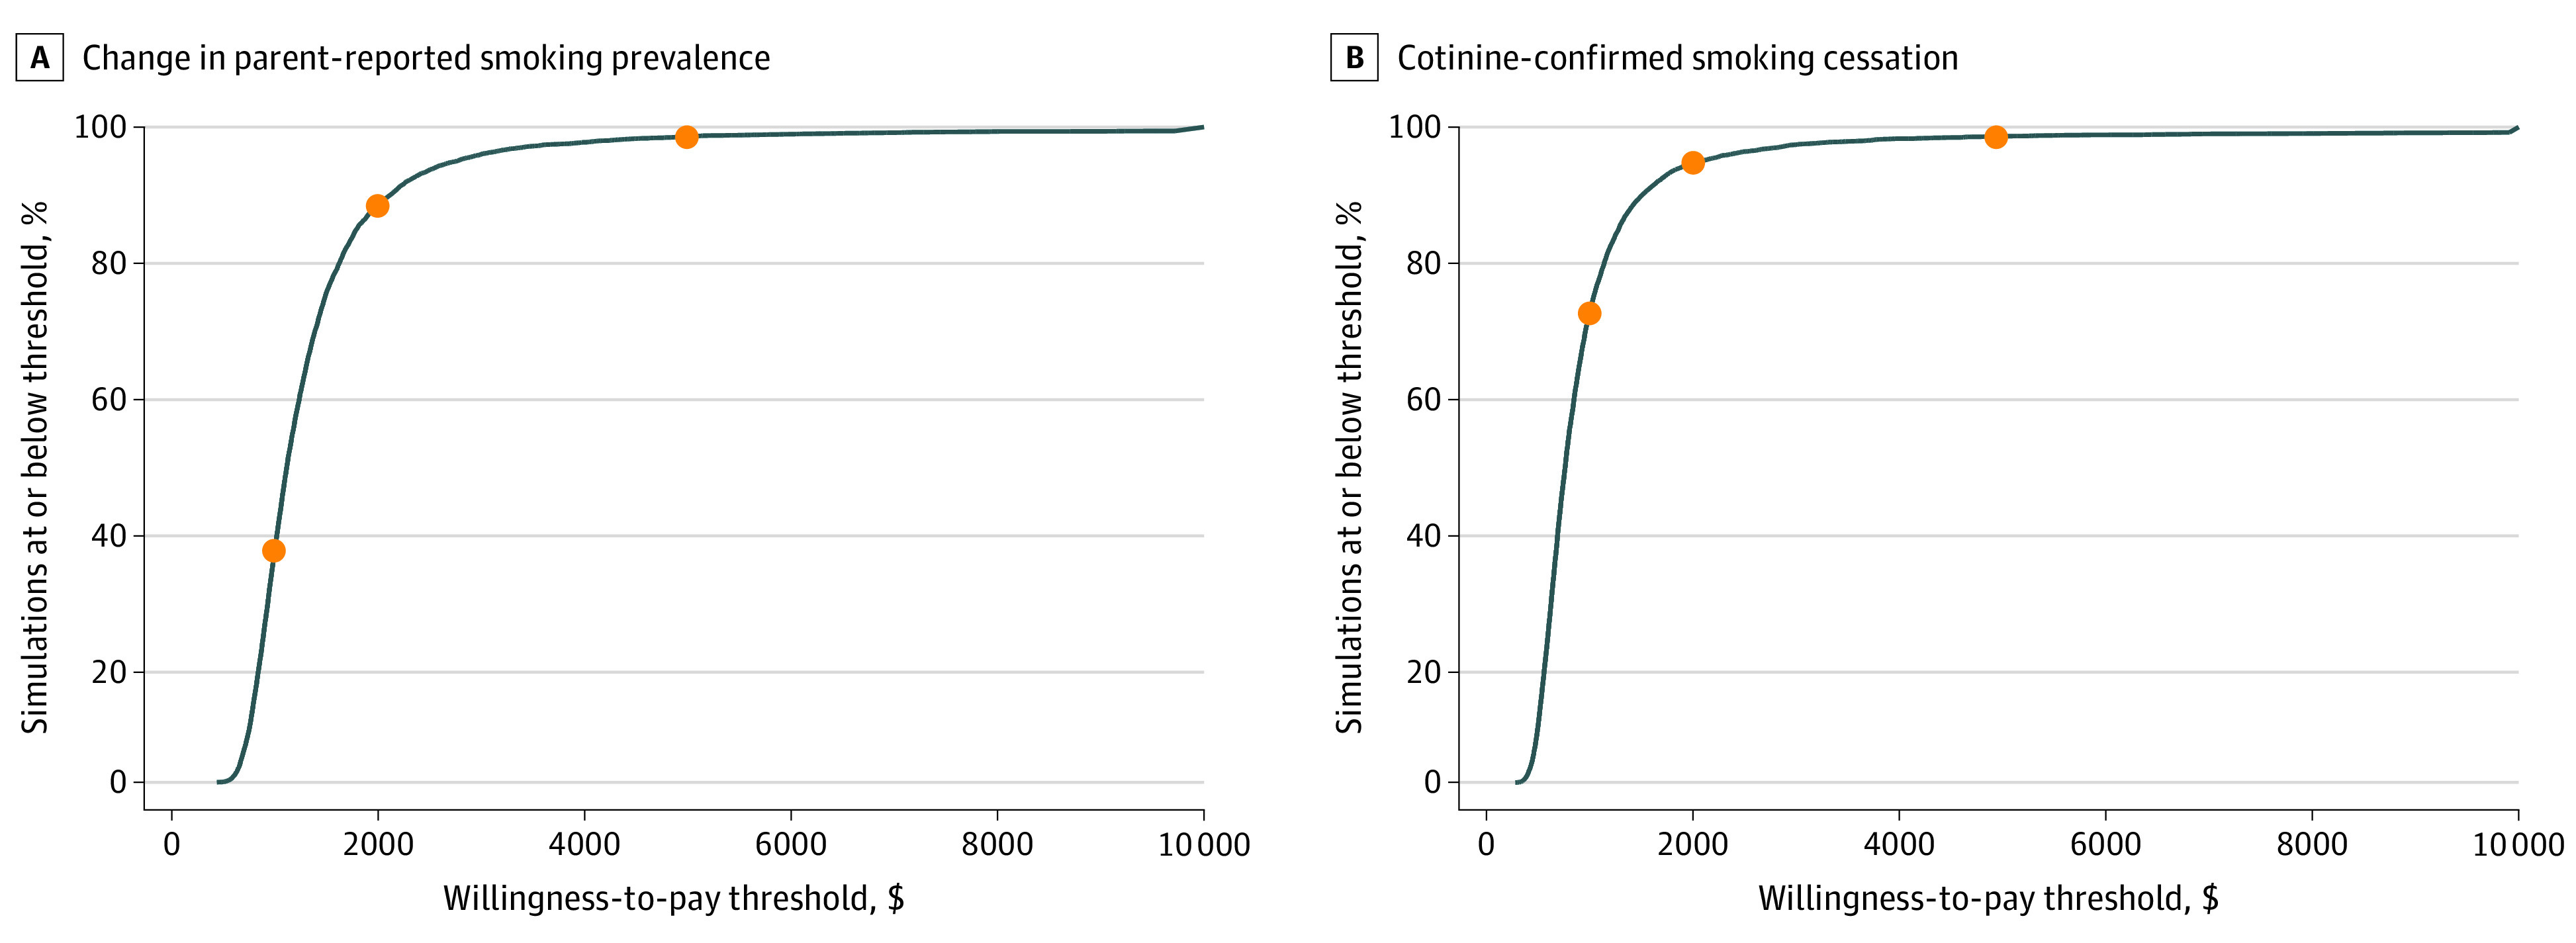
Figure 1. Cost-effectiveness Acceptability Curves.

Graphs show change in parent-reported smoking prevalence (A) and cotinine-confirmed smoking cessation (B). These graphs represent the percentage of simulations in which the program would be considered cost-effective, according to different willingness-to-pay thresholds taken by a health care organization. For example, in panel A, if a health care organization was willing to pay $2000 per parent-reported quit, simulation results show that there is an 88.0% likelihood that the intervention would have an incremental cost-effectiveness ratio below $2000 per quit. Circles indicate willingness-to-pay thresholds at $1000, $2000, and $5000.
