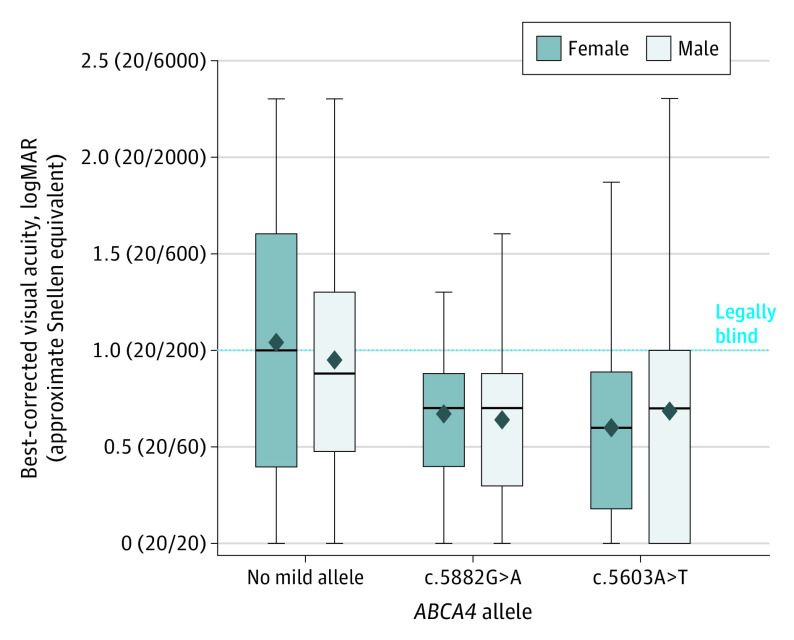
Figure. Distribution of Best-Corrected Visual Acuity in Patients With No Mild Alleles, the c.5882G>A p.(Gly1961Glu) Allele, and the c.5603A>T p.(Asn1868Ile) Allele in ABCA4.
The box plots represent the distribution of best-corrected visual acuities of patients with autosomal recessive Stargardt disease. In each box plot, mean values are denoted by diamonds, and median values are denoted by midlines. Upper and lower limits of the box plots show the interquartile ranges. Whiskers indicate maximum and minimum values. Best-corrected visual acuity of each eye was measured by Snellen scale and converted to logMAR. The dotted line marks the lower limit of legal blindness, which is defined as 20/200 or worse (logMAR ≥ 1.0). A logMAR of 2.0 (20/2000) indicates counting fingers, and a logMAR of 2.5 (20/6000) indicates hand motions.

