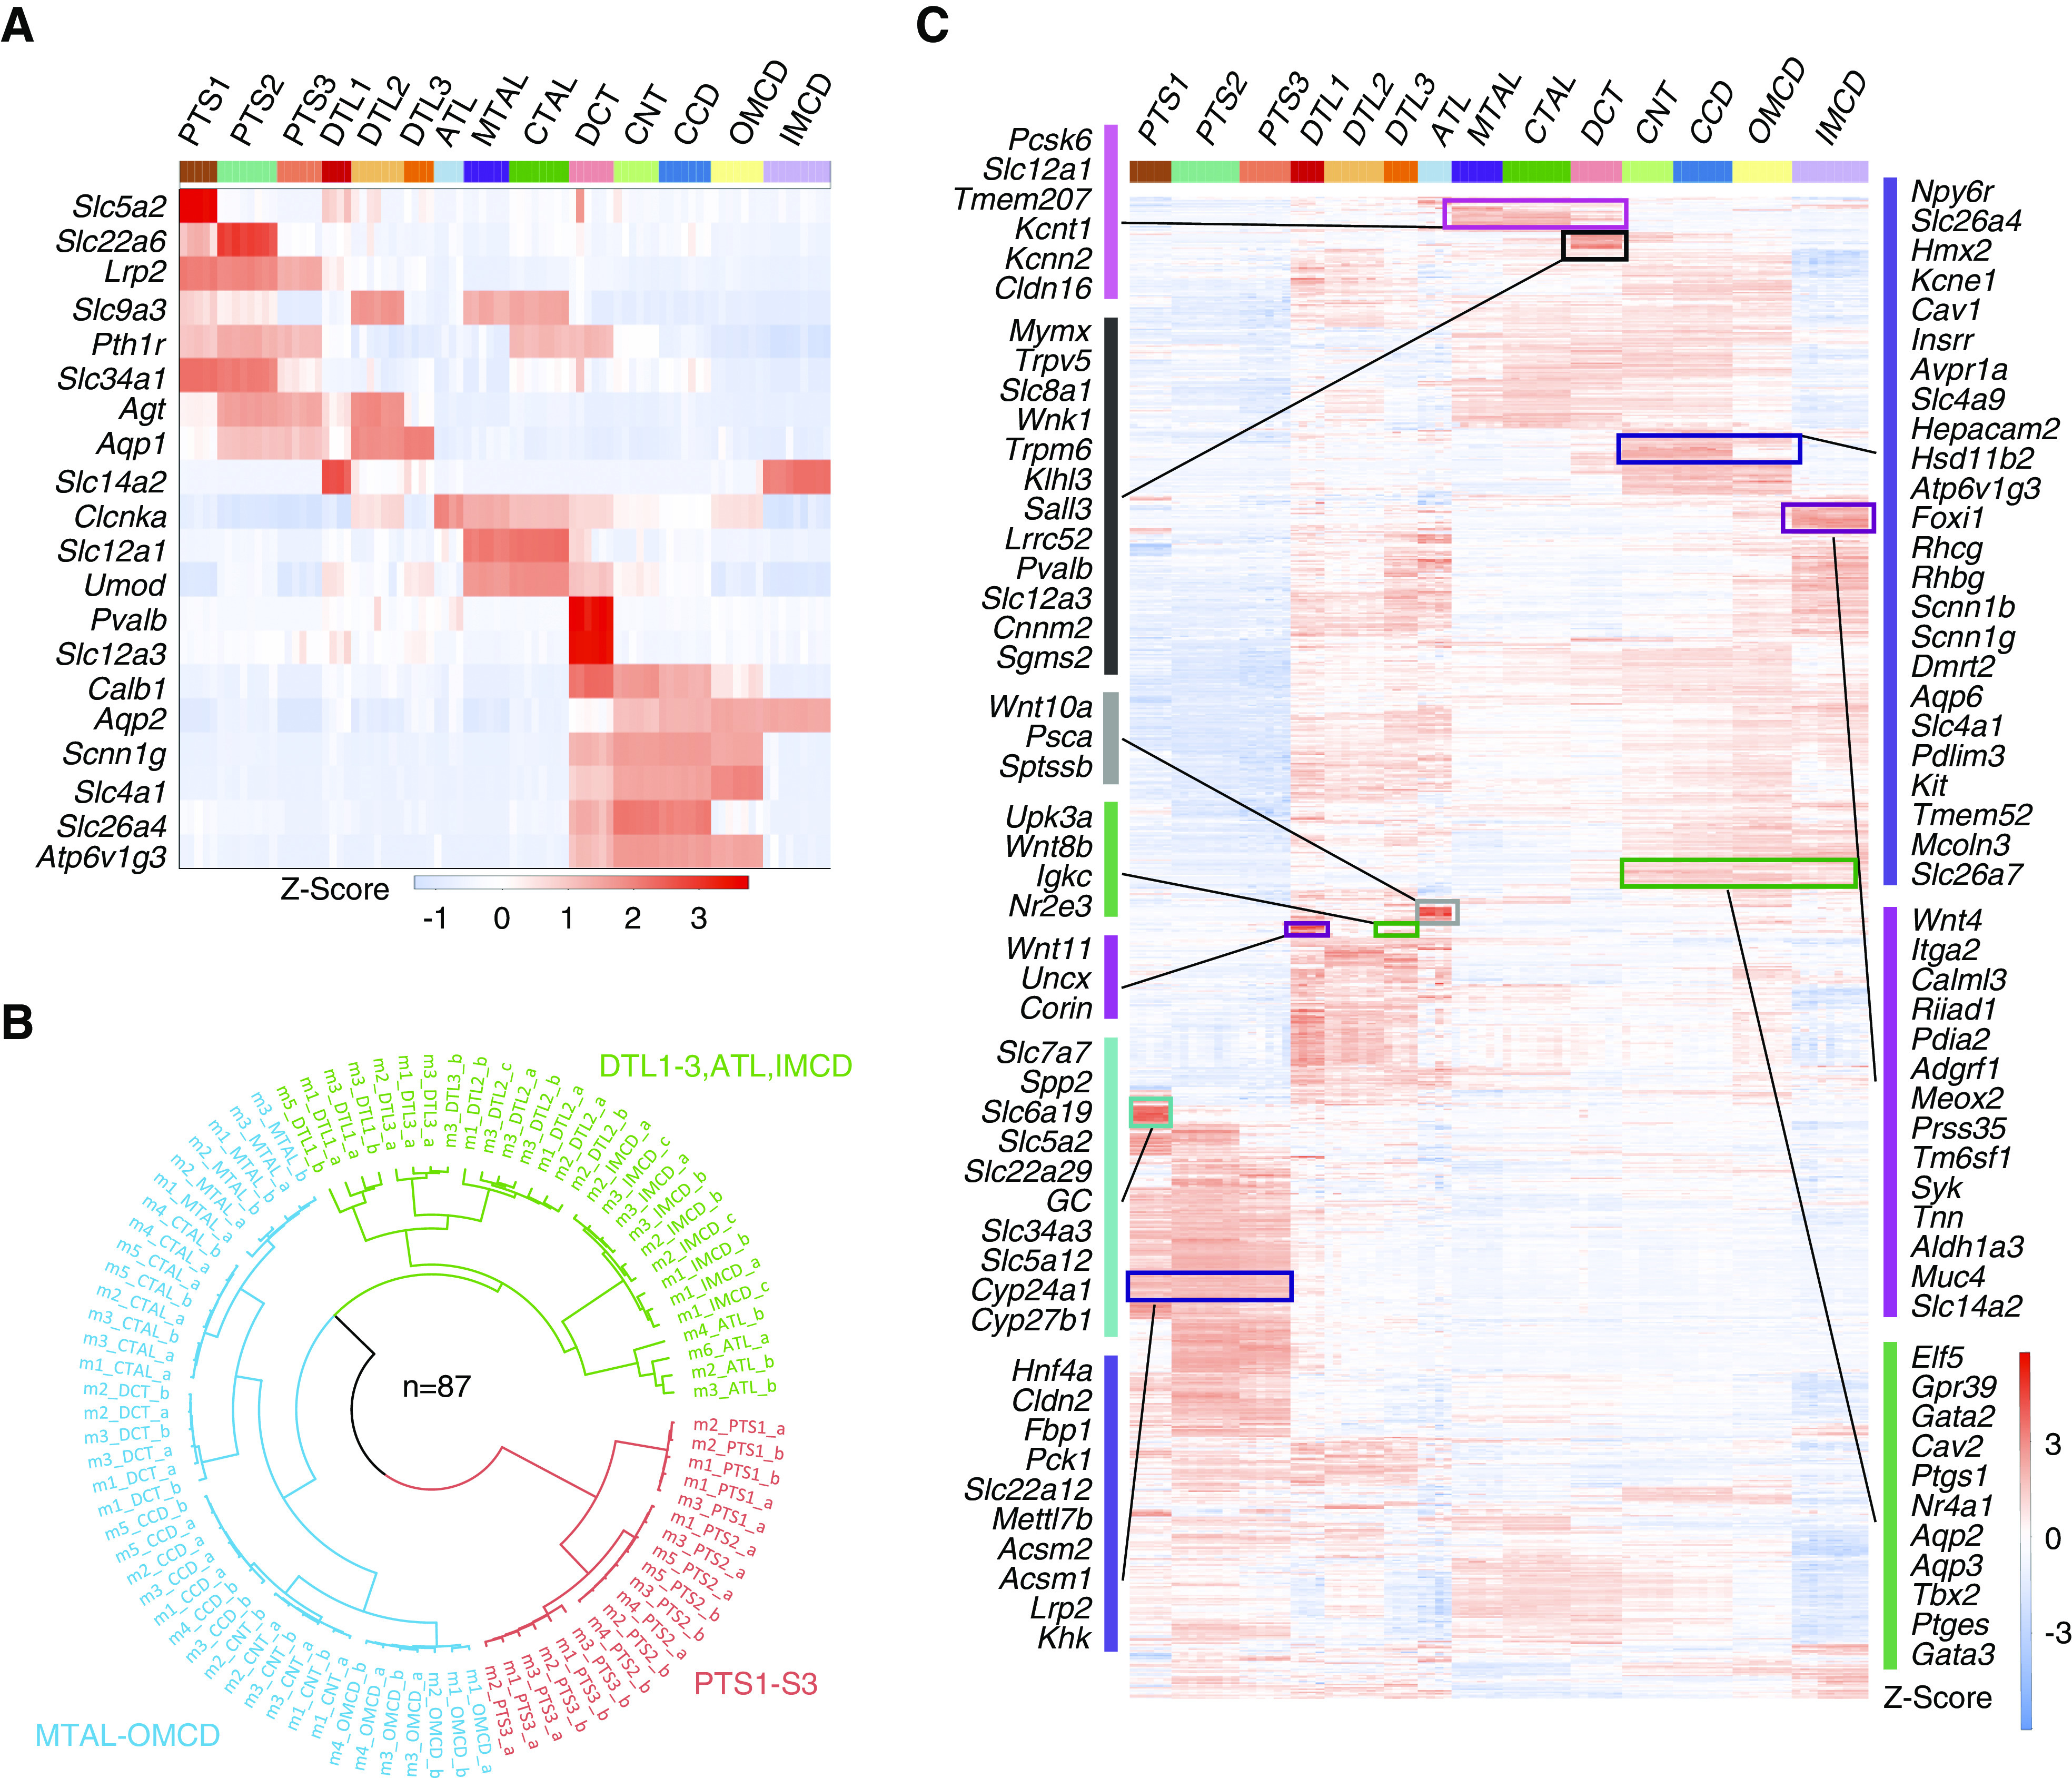
Figure 2.

Gene expression along renal tubule segments. (A) Heatmap showing the expression pattern of classic renal tubule markers. Columns are individual renal tubule replicates and rows are marker genes. Color bar (top) indicates different renal tubule segments. Red color indicates high expression, and blue color indicates low expression. Z-score was calculated from log2(TPM+1) using the scale function. (B) Three major renal tubule clusters were revealed in which the PTs were clustered together (red), segments from the MTAL through the OMCD formed a second group (blue), and thin limbs of the loop of Henle and IMCDs formed a third group (green). The polar dendrogram was built by hierarchic clustering analysis. Sample identifiers refer to both biologic and technical information. (C) Heatmap displaying the scaled expression pattern of 3709 DEGs along the renal tubule segment. The full gene list is provided in Supplemental Table 4.
