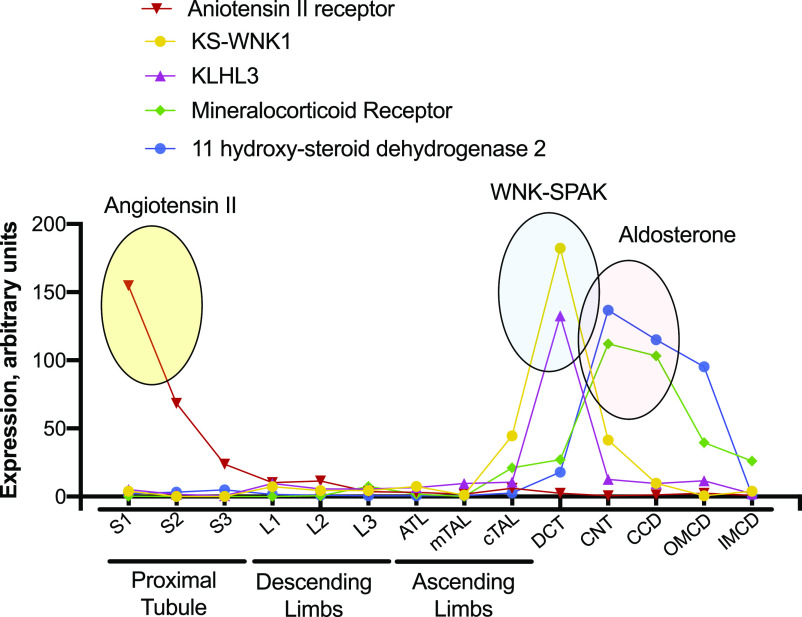
Figure 1.
Sites of relative gene expression along the nephron. Ovals emphasize predominant expression sites for components of signaling pathways. Note the preponderance of AngII receptors along the proximal tubule (yellow oval), the expression of KLHL3 and KS-WNK1 along the DCT (blue oval), and the expression of 11 β-hydroxysteroid dehydrogenase 2 along the connecting tubule and cortical collecting duct (red oval). S1–S3, segments of the proximal tubule, L1–L3, segments of the descending limbs, ATL, ascending thin limb; TAL, thick ascending limb; CNT, connecting tubule; CCD, cortical collecting duct; OMCD, outer medullary collecting duct; IMCD, inner medullary collecting duct. Redrawn from https://esbl.nhlbi.nih.gov/MRECA/Nephron/.

