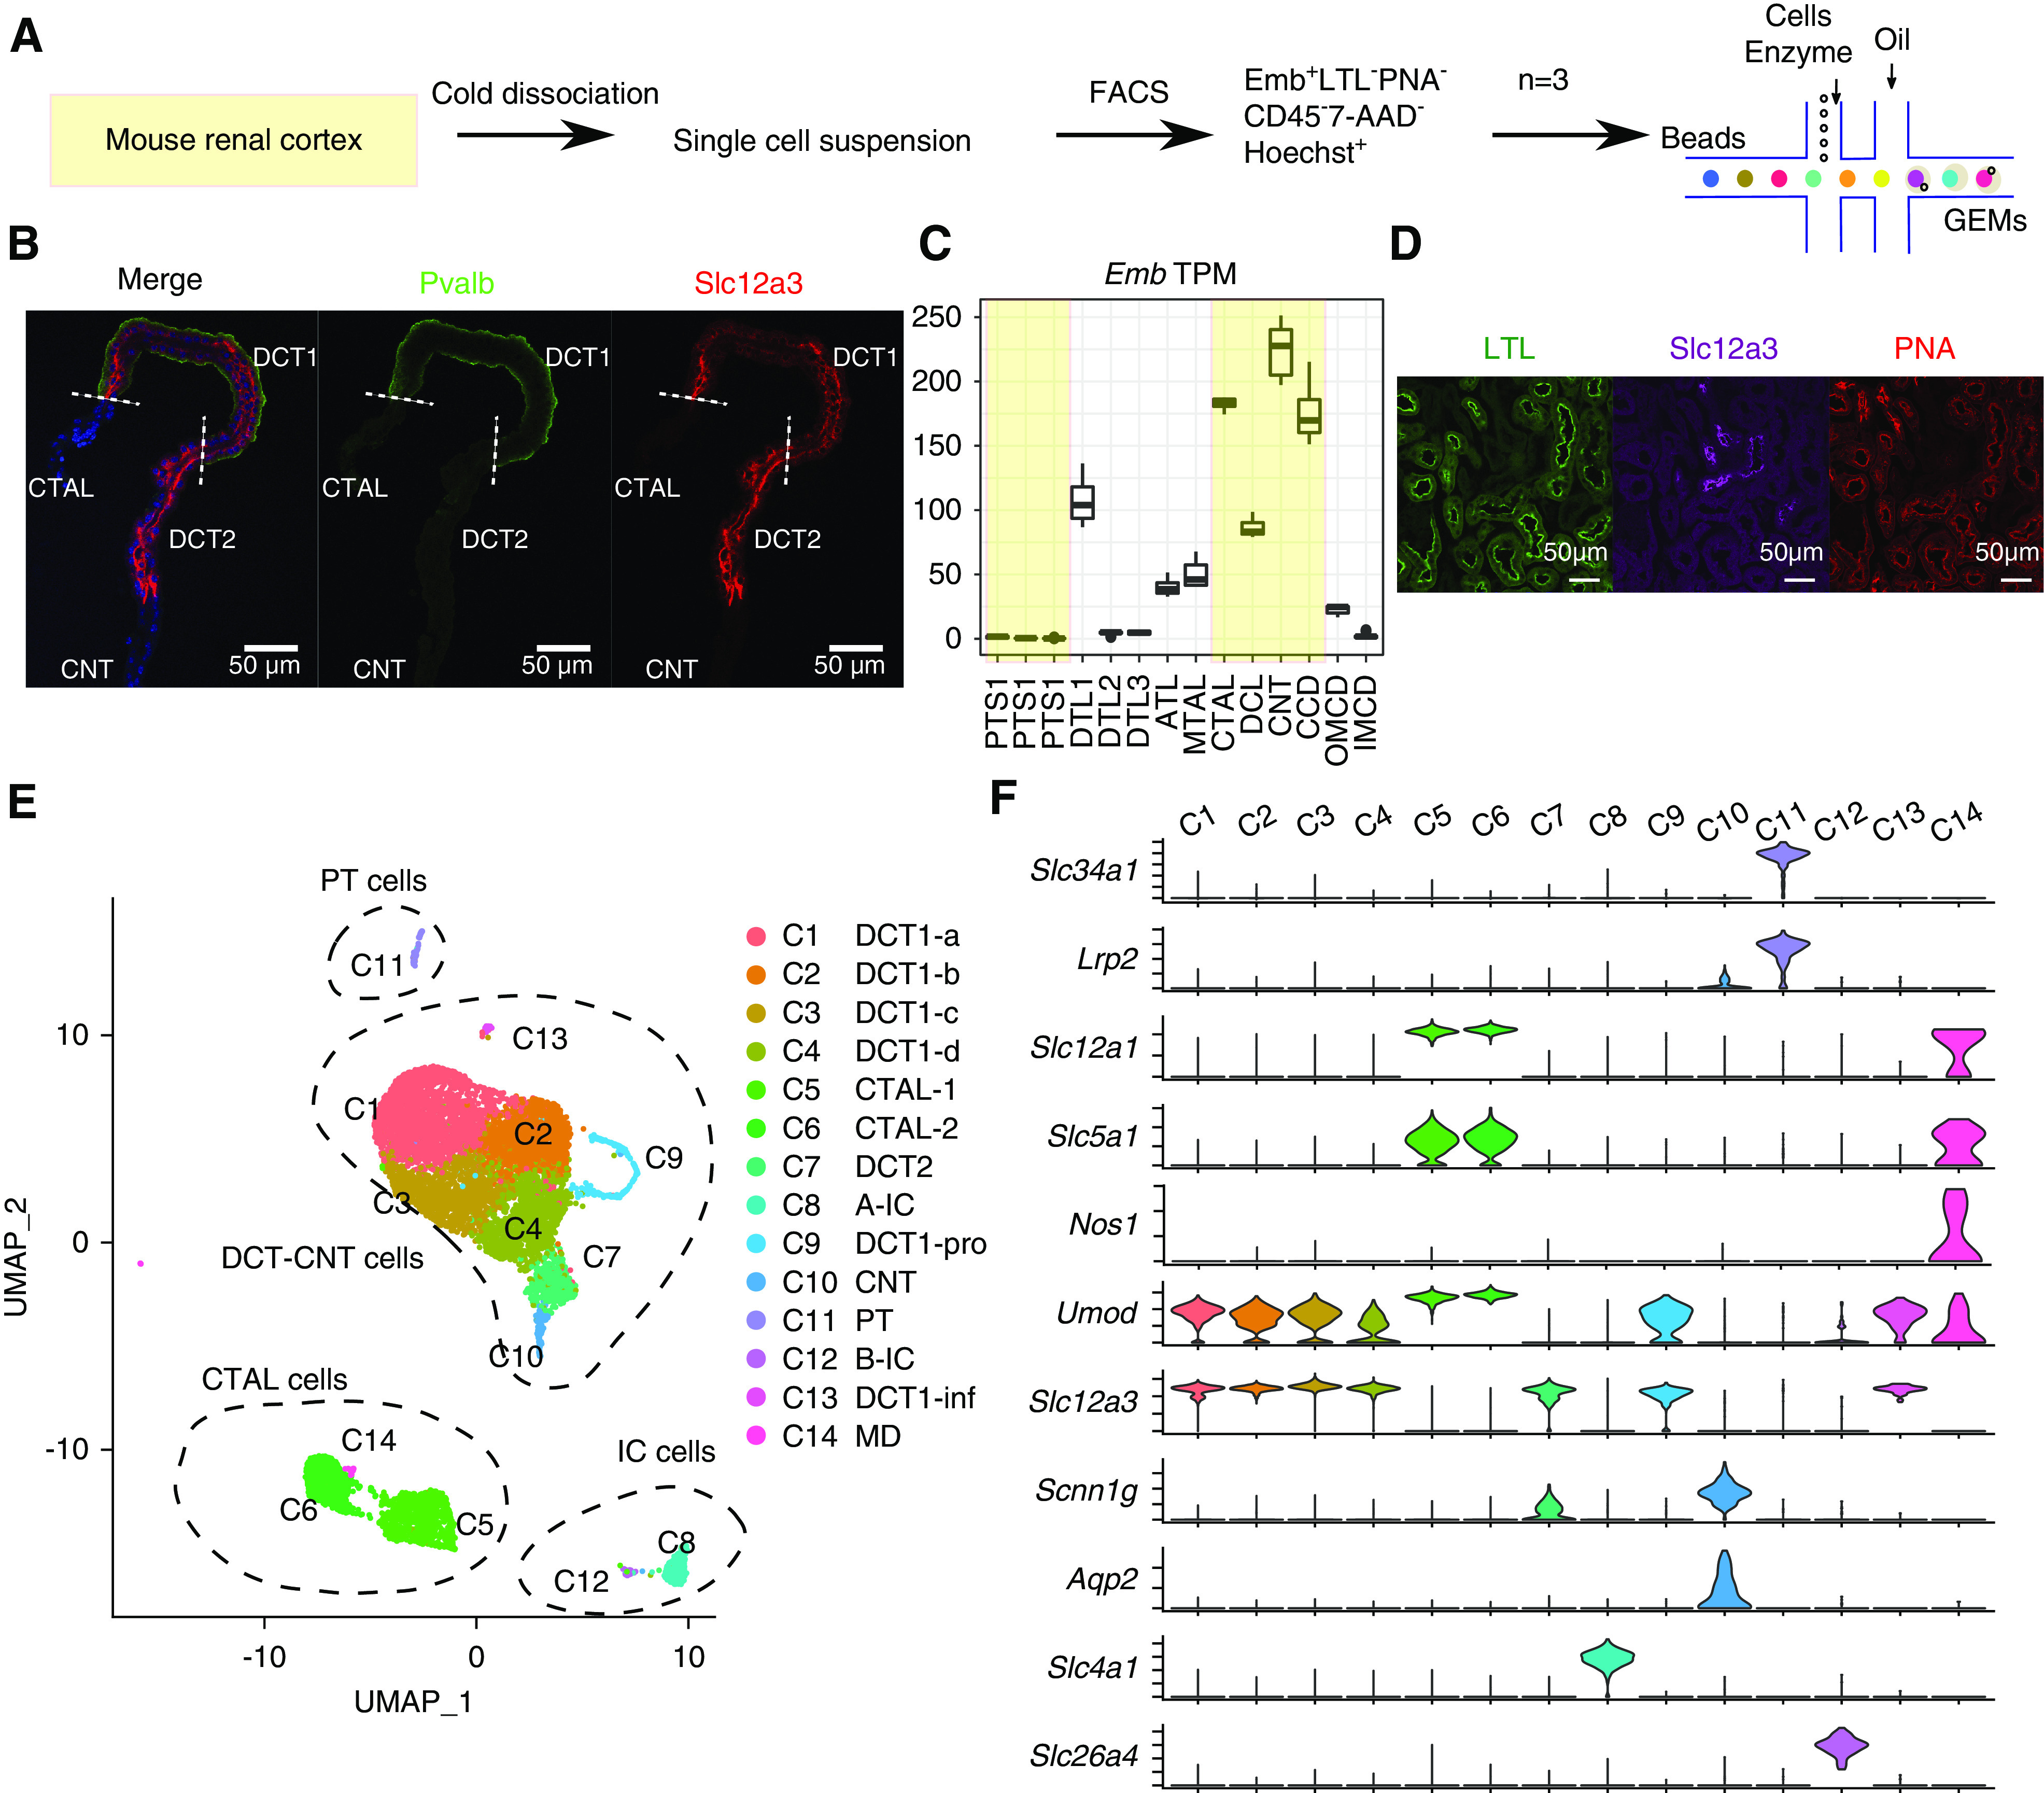
Figure 1.

scRNA-seq of DCT cells. (A) Overview of protocol for the enrichment of DCT cells for single-cell analysis. (B) Immunostaining showing the distribution of Slc12a3 (red) and Pvalb (green) in microdissected CTAL to CNT region. Nuclei are stained using DAPI (blue). Scale bars, 50 μm. DAPI, 4′,6-diamidino-2-phenylindole. (C) Distribution pattern of Embigin transcript along the mouse renal nephron segments.24 The tubules in the renal cortex are shown in shaded yellow. TPM, Transcripts Per Million. (D) Embigin was used as a positive surface marker for DCT and thick ascending limb cells and a negative marker for proximal tubule cells and principal cells. (E) UMAP projection of cells from all three 10× Chromium datasets. Different clusters are colored and labeled. Four major clusters are highlighted by dashed circles and annotated on the basis of (F). (F) Violin plots of renal cell marker genes across all clusters. Cluster information is shown at the top.
