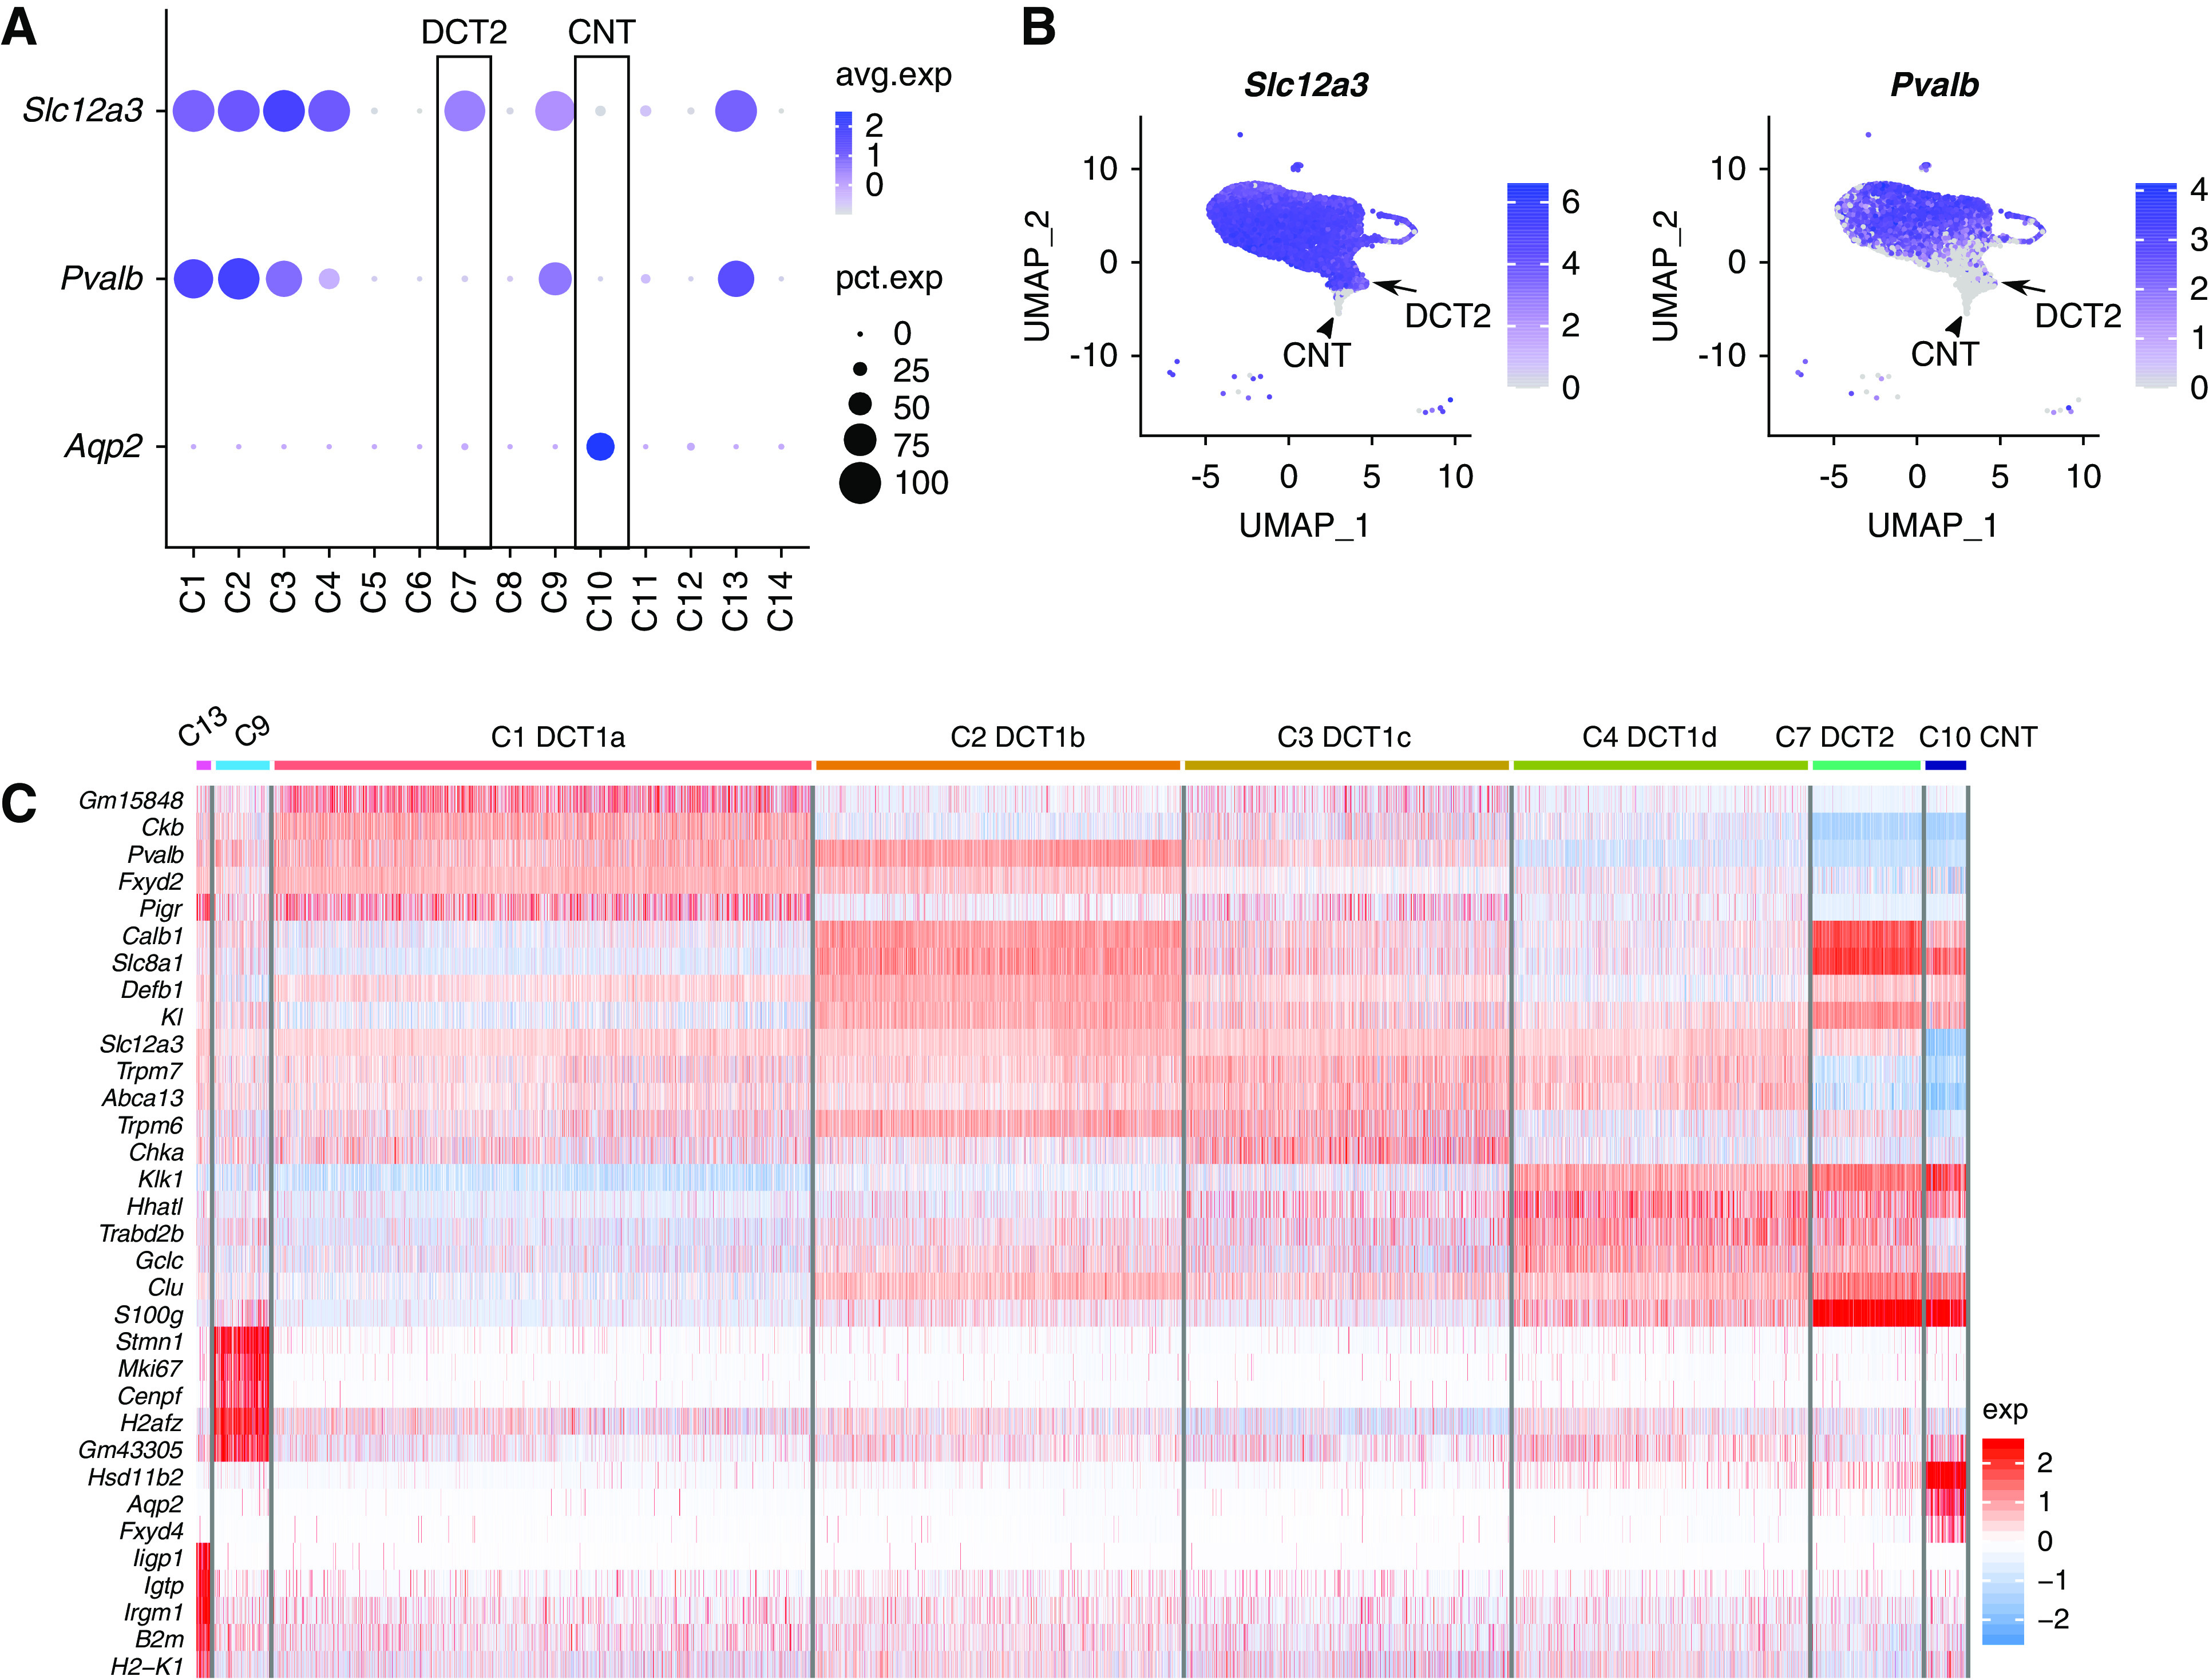
Figure 2.

Heterogeneity of DCT cells revealed by scRNA-seq. (A) Dot plot showing the distribution of Slc12a3, Pvalb, and Aqp2 expression across the clusters. Data are normalized and scaled (z score) to examine relative expression across the cell clusters; “avg.exp” is the z score of the average gene expression of all cells within a cluster (scaled values), and “pct.exp” is the percentage of cells with nonzero gene expression. (B) UMAP projection for Slc12a3 and Pvalb expression. Arrows point to DCT2 cells; arrowheads point to CNT cells. (C) Heat map showing the top five genes in DCT and CNT cell clusters. Data are scaled (z score). A similar analysis is also provided in Supplemental Figure 2.
