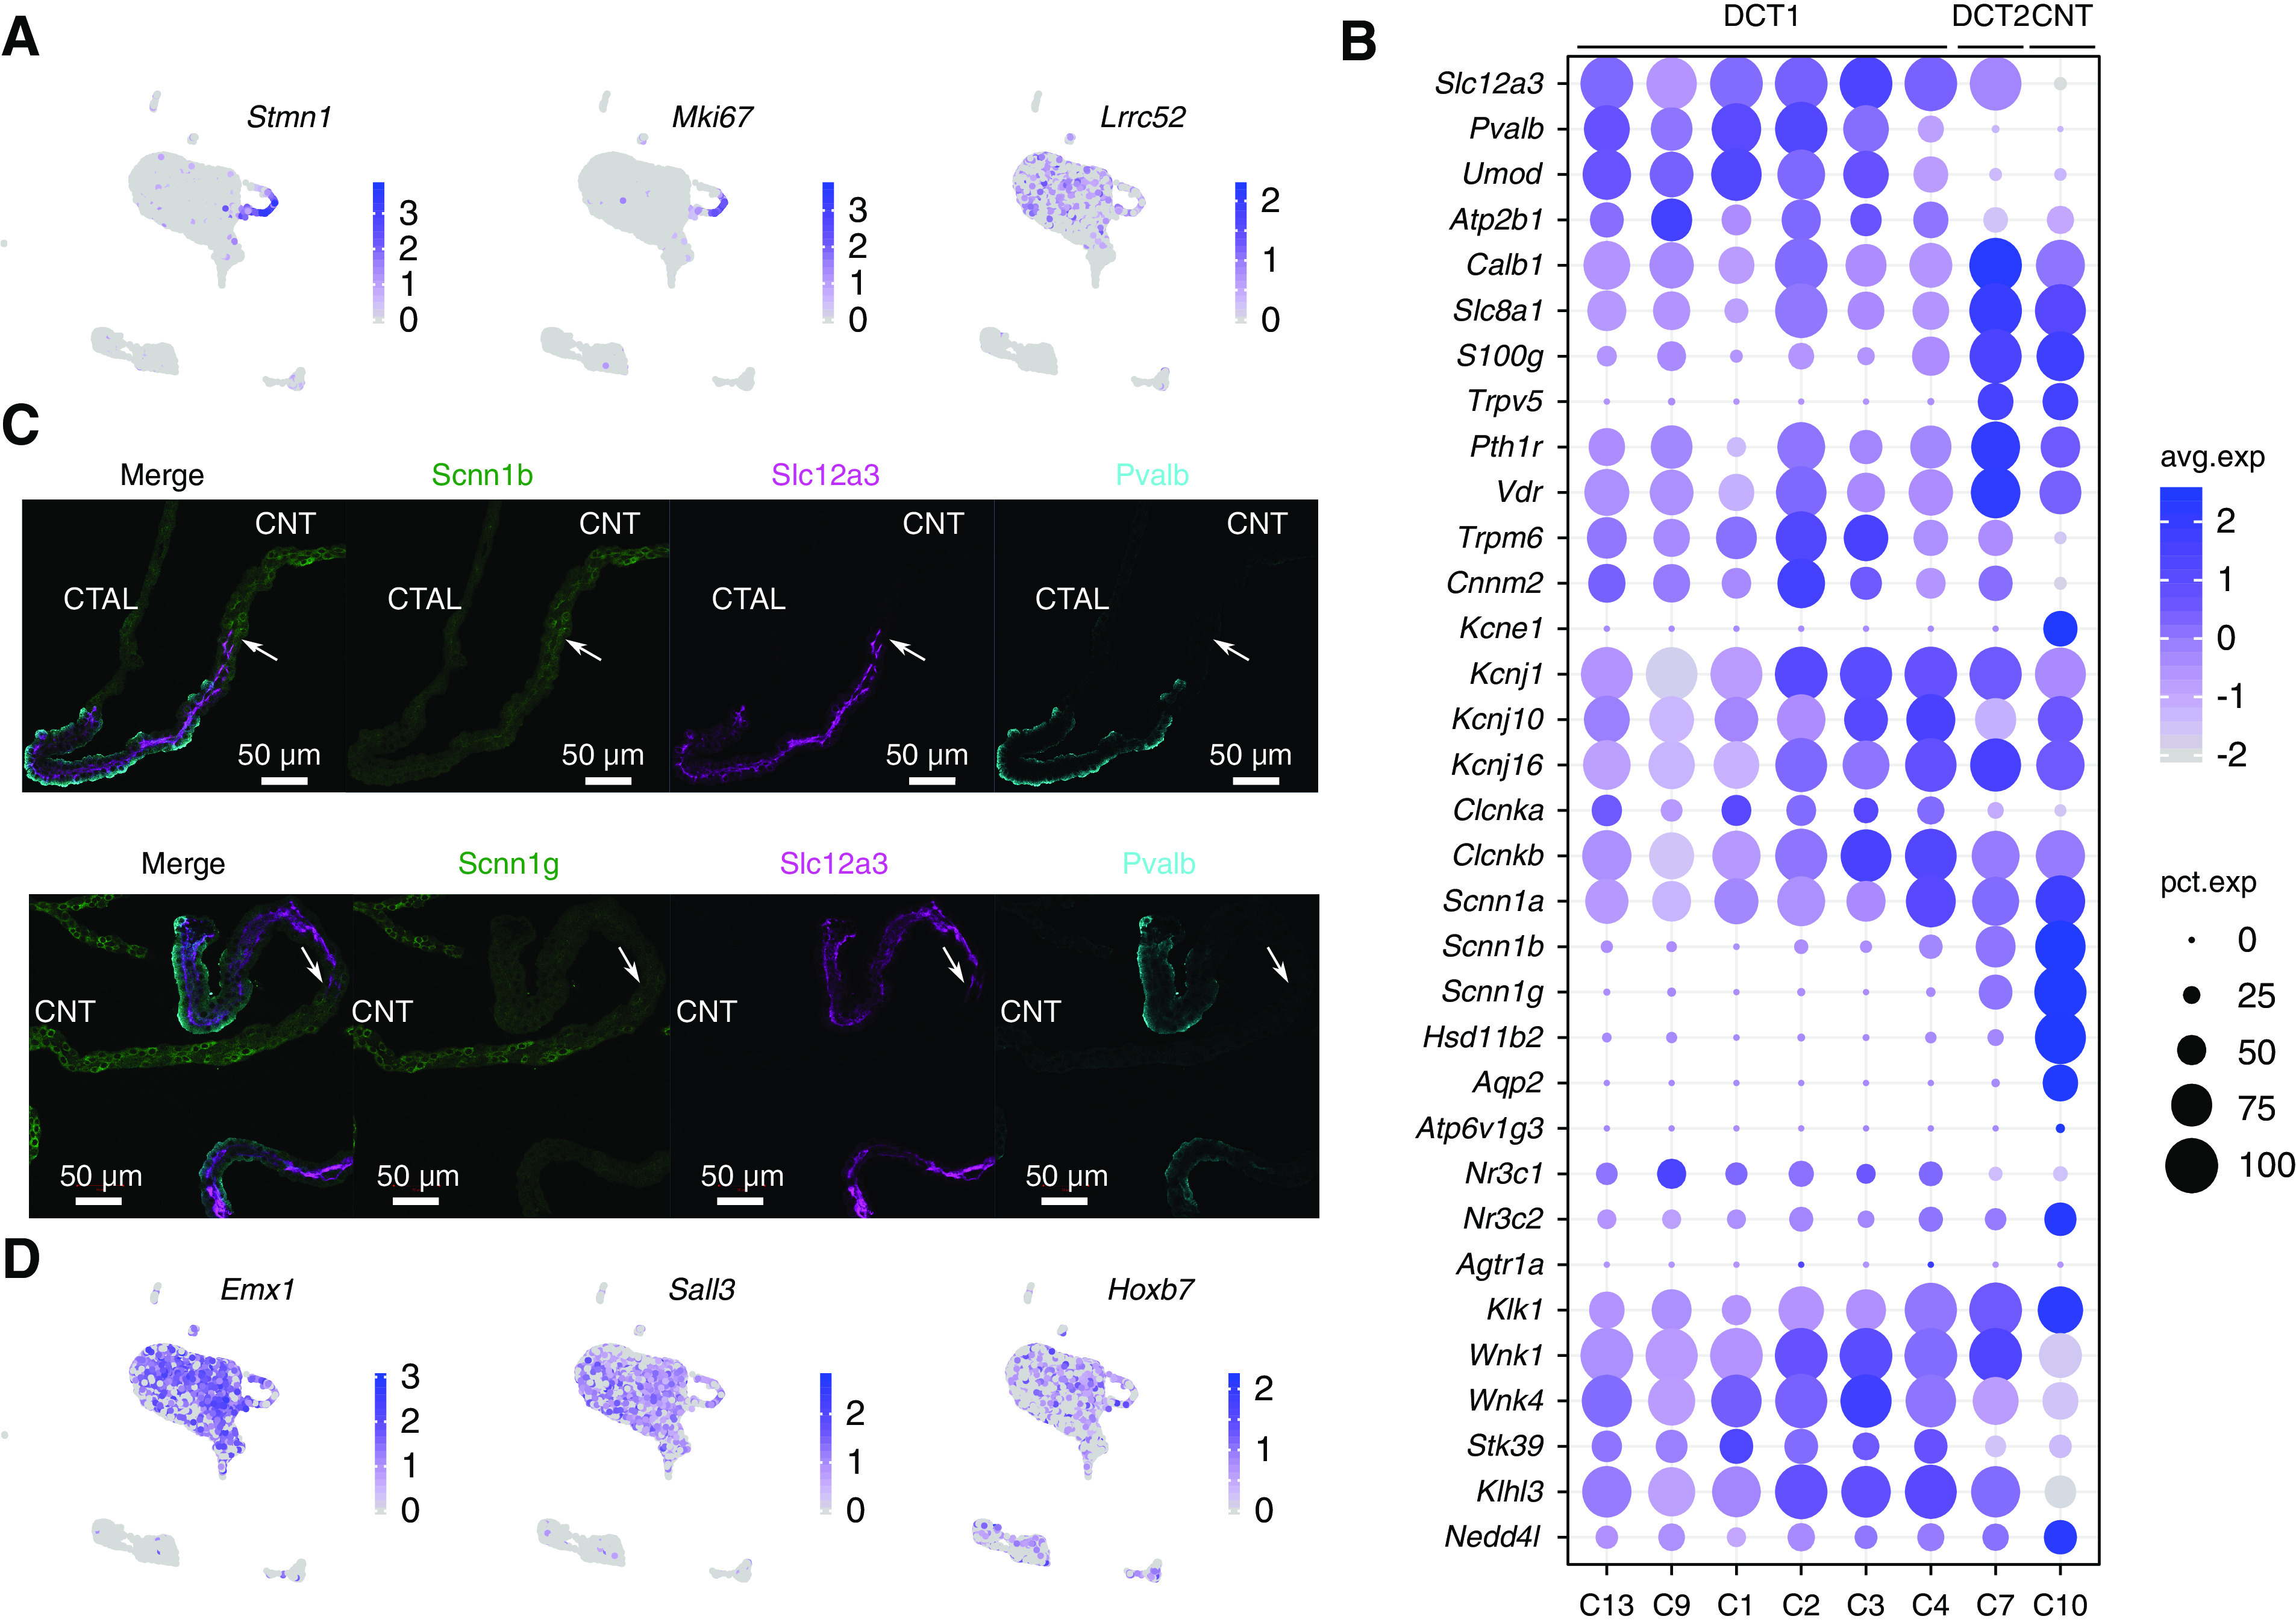
Figure 3.

Distributions of transcripts associated with major transport pathways in DCT cells. (A) UMAP projection for Stmn1, Mki67, and Lrrc52. (B) Distribution of major transport pathways in DCT cells; “avg.exp” is the z score of the average gene expression of all cells within a cluster (scaled values), and “pct.exp” is the percentage of cells with nonzero gene expression. (C) Immunostaining showing Scnn1b and Scnn1g expression in microdissected tubule from the CTAL-DCT-CNT region. Scnn1b and Scnn1g are in green, Slc12a3 is in purple, Pvalb is in cyan, and DNA is in blue. Arrows point to regions at the point of initial expression of Scnn1b and Scnn1g. Scale bars, 50 µm. (D) UMAP projection for Emx1, Sall3, and Hoxb7.
