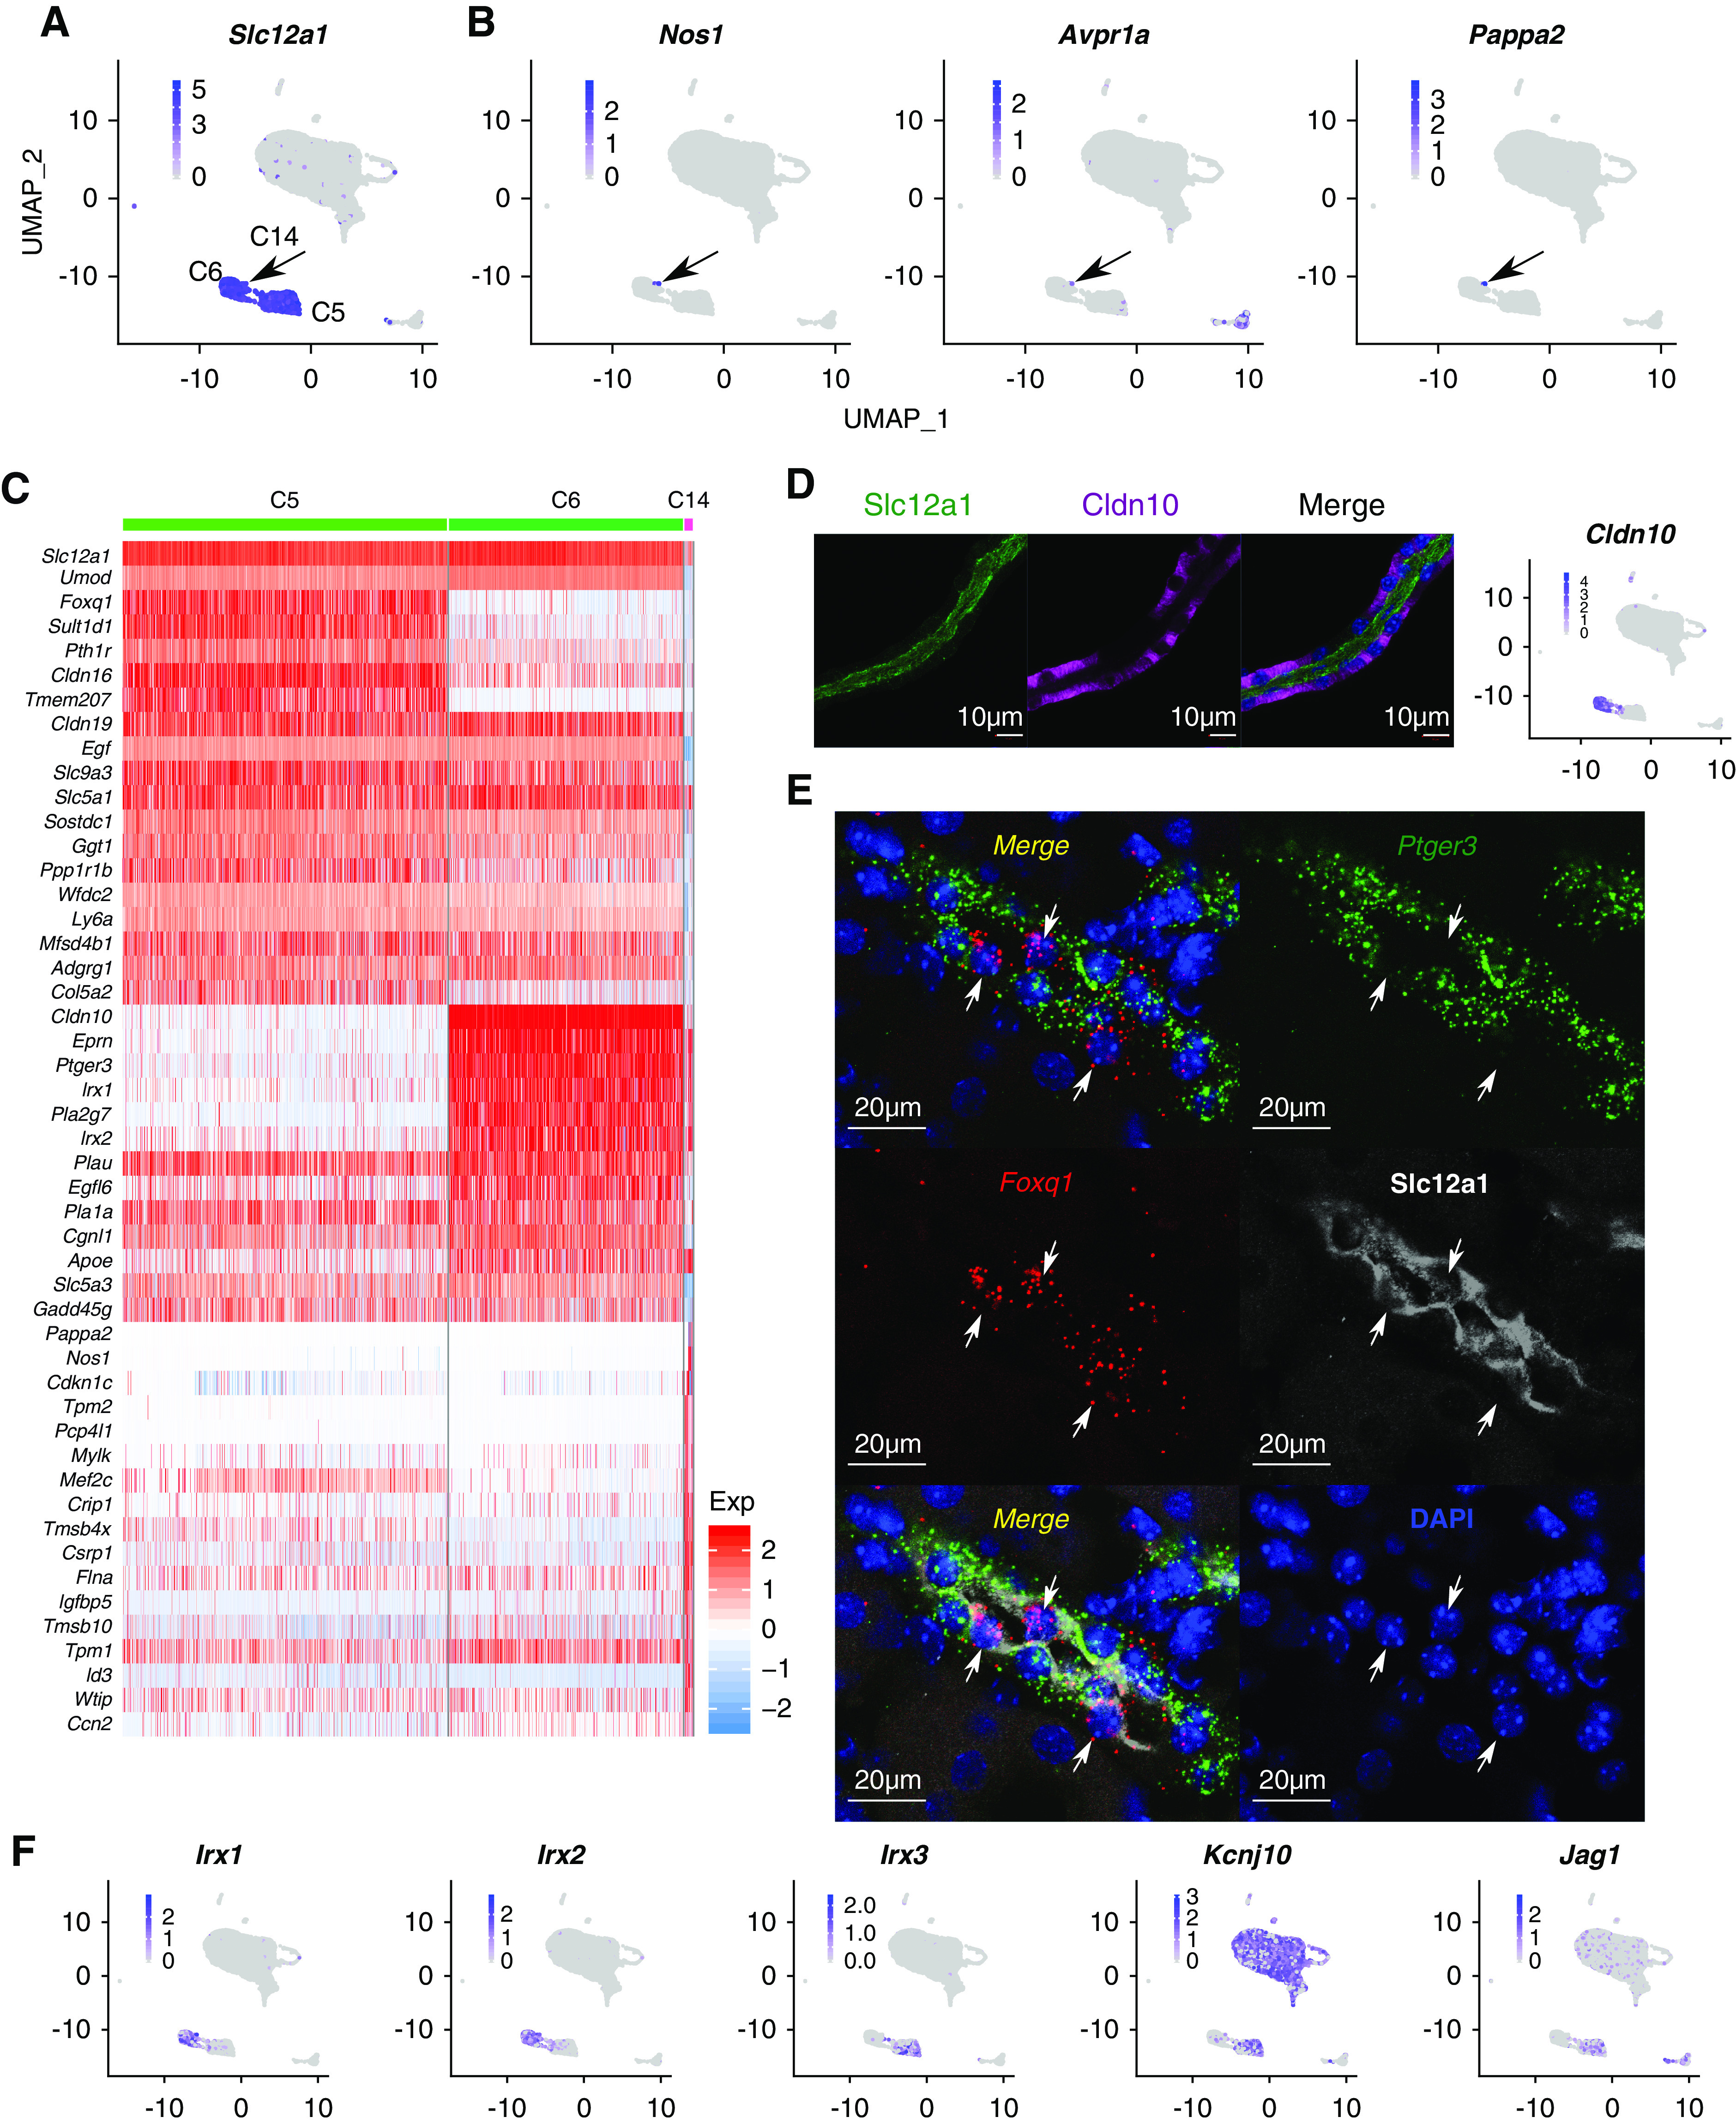
Figure 4.

Single-cell analysis of CTAL cells. (A) UMAP visualization of Slc12a1. (B) UMAP plot for Nos1, Avpr1a, and Pappa2. (C) Heat map showing the top 20 marker genes in C5, C6, and C14. Each column indicates a cell. Colors indicate the expression level (z score). (D) Immunostaining showing Slc12a1 (green) and Cldn10 (purple) on a microdissected mouse TAL. Nuclei are stained with DAPI (blue). DAPI, 4′,6-diamidino-2-phenylindole. The feature plot for Cldn10 is shown in the right panel. Scale bars, 10 µm. (E) Immunostaining coupled with in situ hybridization (RNAscope) showing Slc12a1 (white), Ptger3 (green), and Foxq1 (red) on mouse kidney section. Nuclei are stained with DAPI (blue). Arrows point to Foxq1+-positive cells (red). Lower-magnification views are provided in Supplemental Figure 4 and can be viewed at https://esbl.nhlbi.nih.gov/MRECA/Supplement/. Scale bars, 20 µm. (F) UMAP visualization of Irx1, Irx2, Irx3, Kcnj10, and Jag1.
