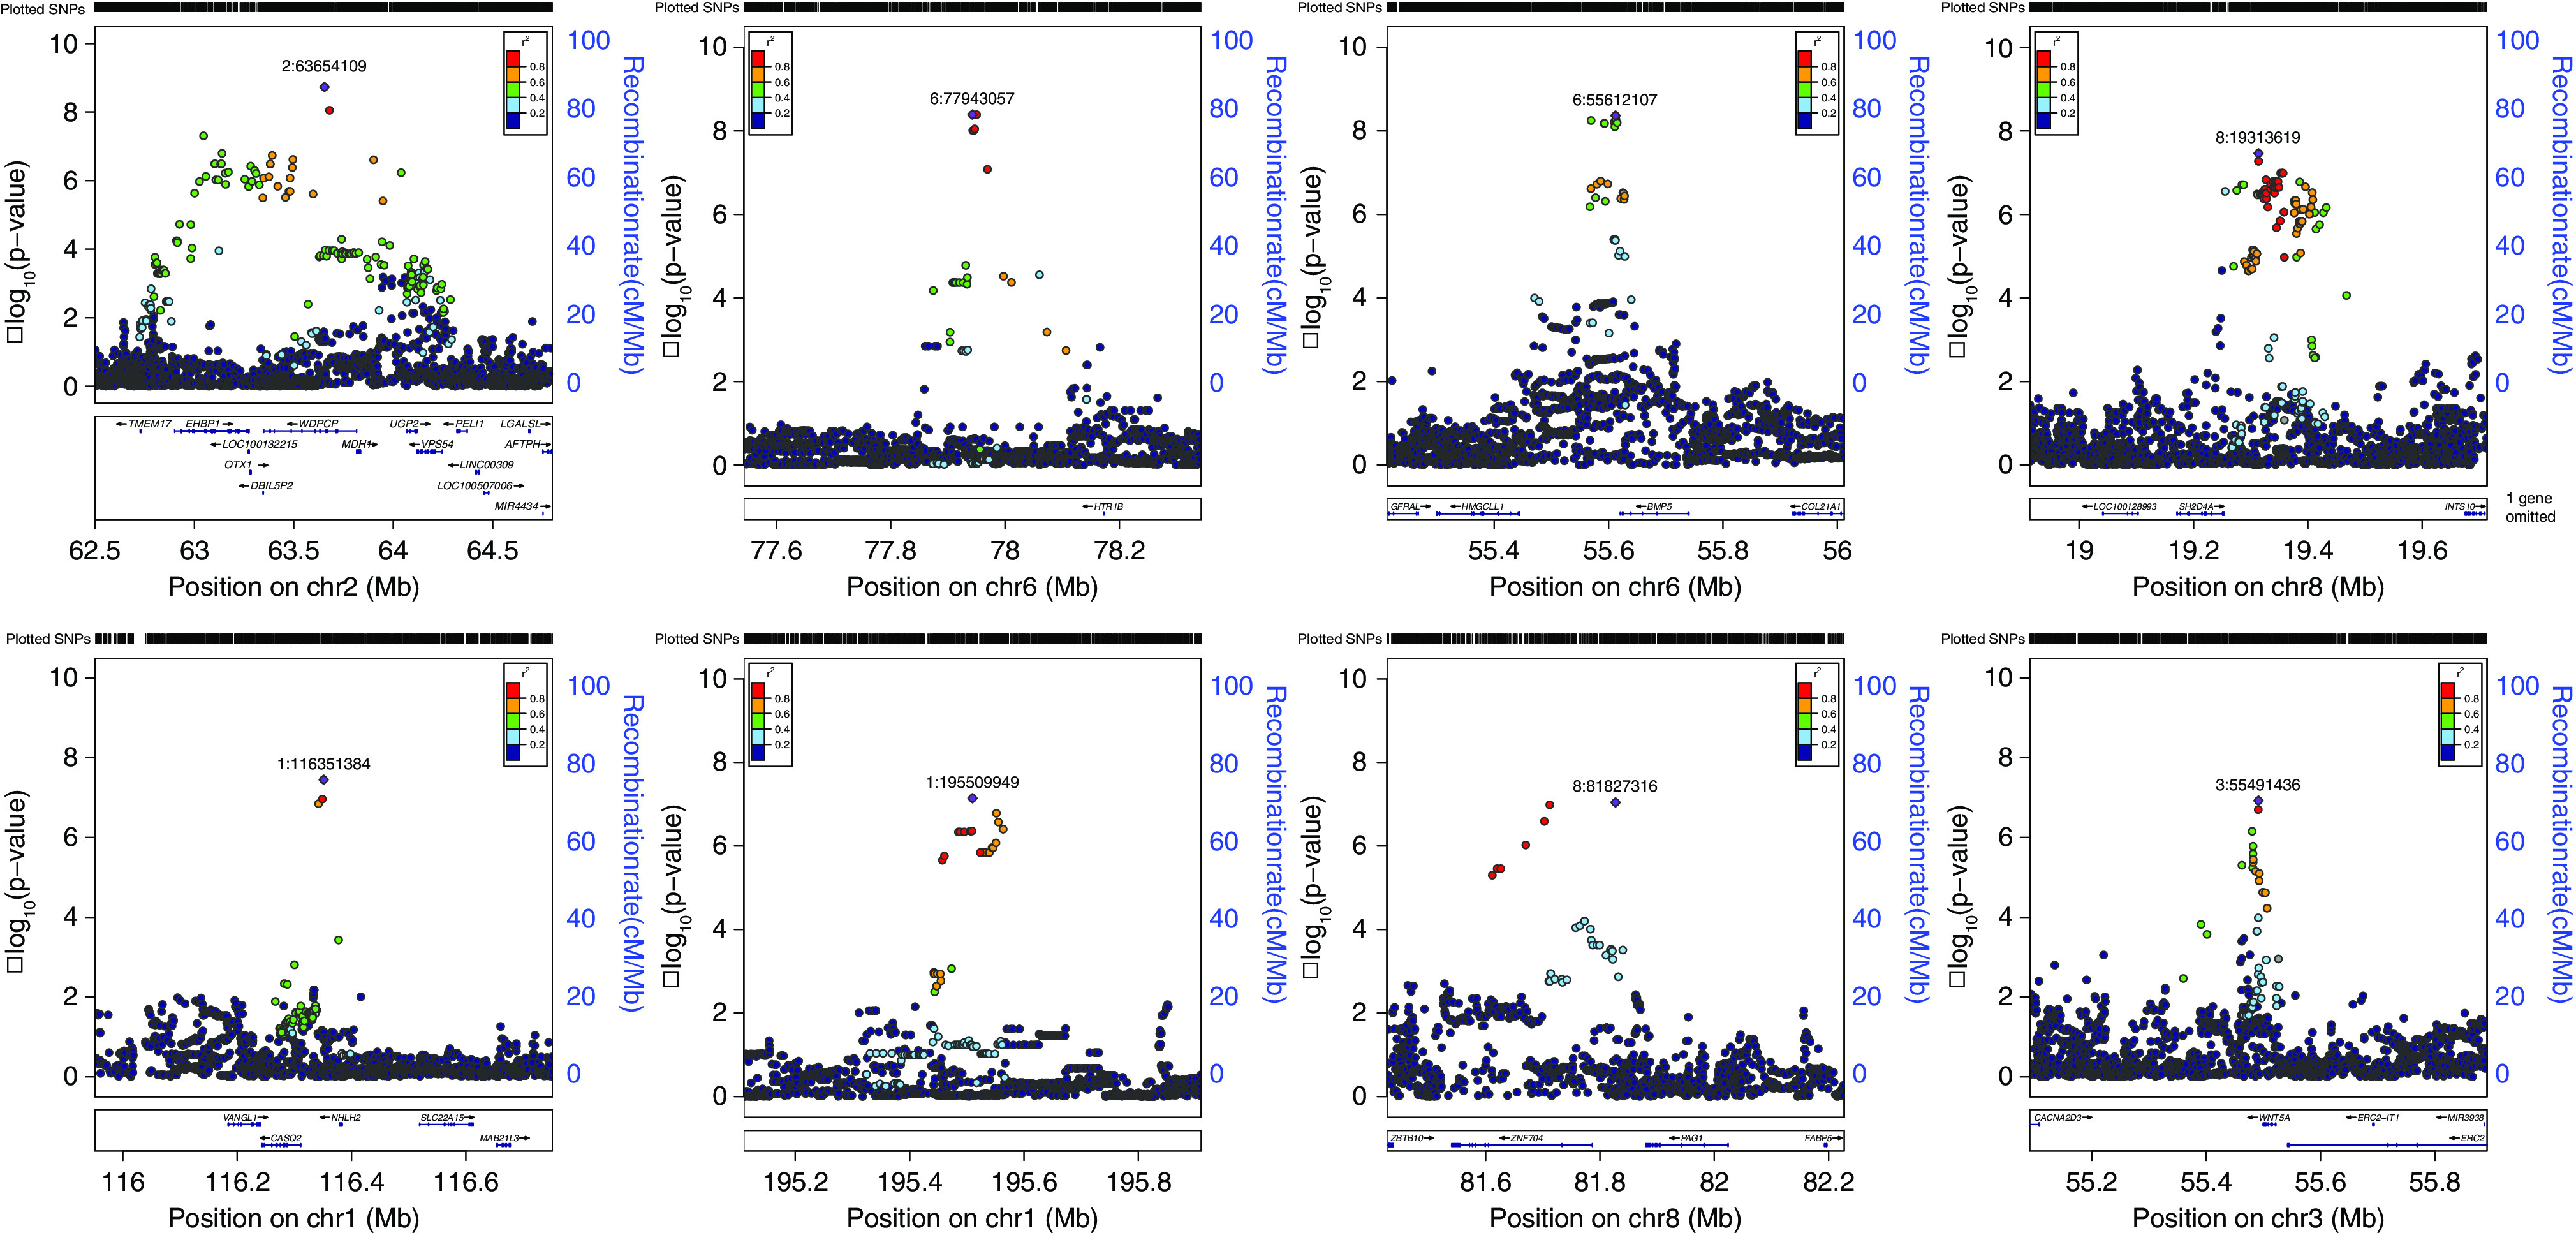
Figure 2.

Regional association plots for loci associated with VUR. The calculated −log10 P values are shown according to genomic position (hg19). The most significant SNP is colored purple. Other colors indicate LD (r2; see inset) to top SNP, based on the 1000 Genomes European sample set.
