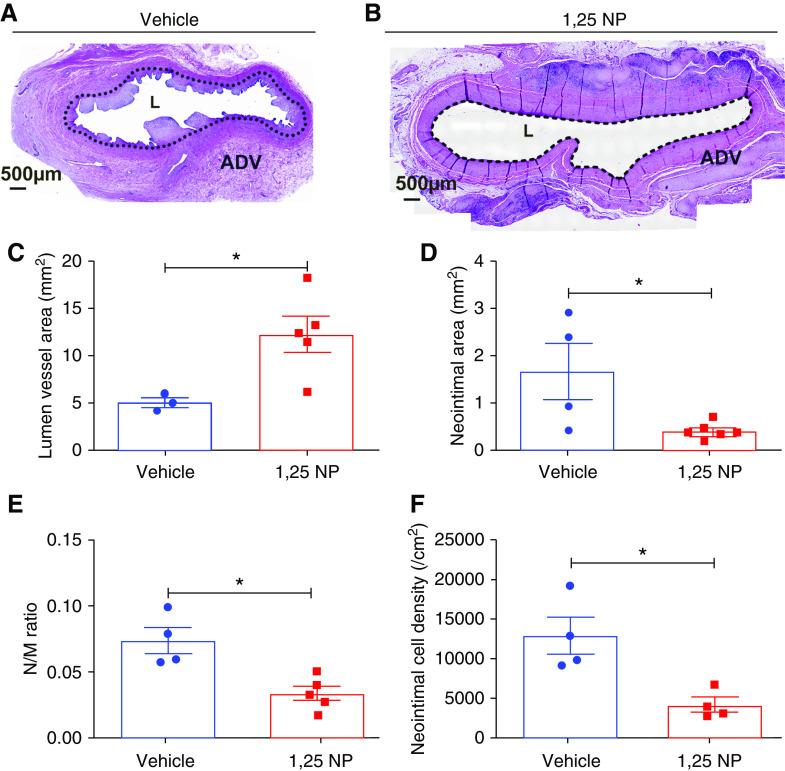
Figure 3.
Histomorphometric analysis of the outflow vein. (A and B) Hematoxylin and eosin staining of outflow vein treated with 1,25 NP and vehicle groups at day 28 after AVF creation. The neointima and media are identified with a dotted line in the ×20 magnification images. Neointima is significantly decreased in the 1,25 NP group compared with vehicle group. (C) The vessel lumen area in the 1,25 NP group is significantly increased compared with vehicle group at day 28. (D) The neointima area in 1,25 NP group is significantly decreased compared with vehicle group at day 28. (E) The ratio of neointima/media is decreased in 1,25 NP group compared with vehicle group at day 28. (F) Cell density in the neointima is decreased in 1,25 NP group compared with vehicle group at day 28. Each bar represents mean±SEM of n≥4. Nonparametric Mann–Whitney test was performed. *P<0.05. L, lumen. Scale bar is 500 µm. ADV, adventitia.

