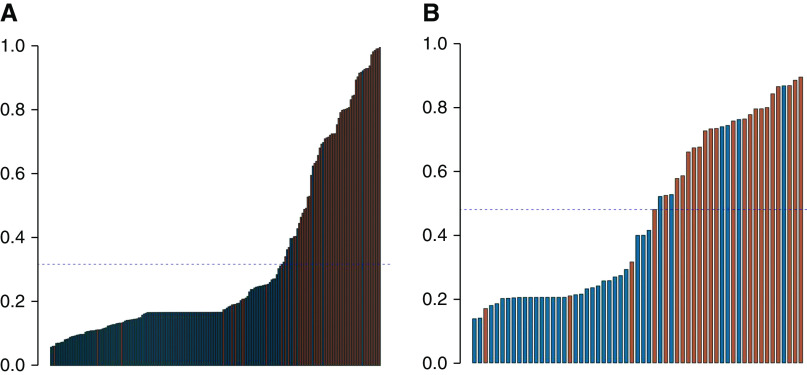
Figure 5.
Waterfall plot of the urinary exosome gene scores demonstrates the high NPV of the exosomal RNA signature. The blue dotted line represents the score cutoff for each of the gene signatures. (A) Discriminating any-cause rejection from no rejection (red bars denote samples that have clinical rejection). (B) Discriminating ABMR from TCMR (red bars denote samples with ABMR).

