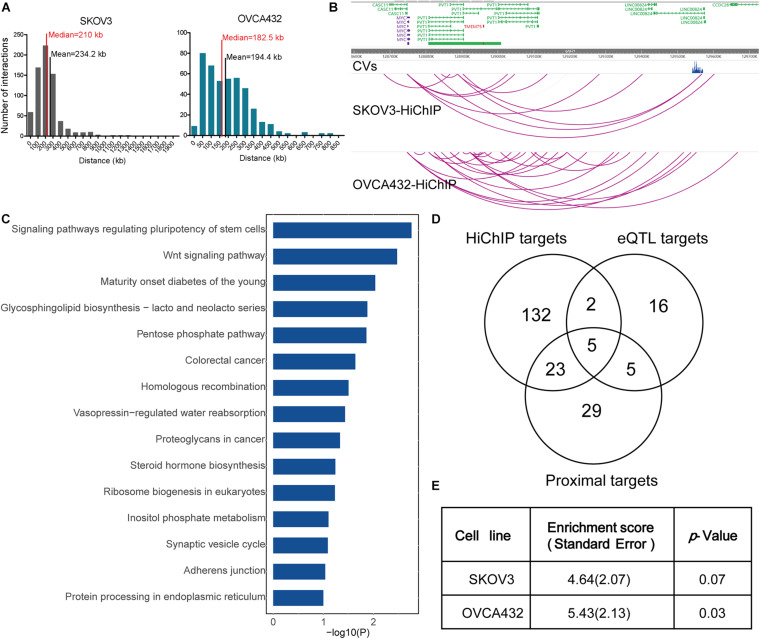
FIGURE 1.
HiChIP identified gene targets for GWAS loci of EOC. (A) Distribution of the distances spanning each CVs involved in the HiChIP loop in SKOV3 and OVCA432. The red line indicates the median distance and the black line indicates the mean distance. (B) Examples of MYC and PVT1 looping to EOC GWAS CVs at 8q21.24 loci. (C) KEGG pathway analysis for HiChIP identified gene targets looping to GWAS CVs. (D) Venn plot displaying the number of HiChIP targets, eQTL targets, and proximal targets of GWAS CVs of EOC. (E) SLDSC enrichment analysis for HiChIP loops identified from SKOV3 and OVCA432 cells.

