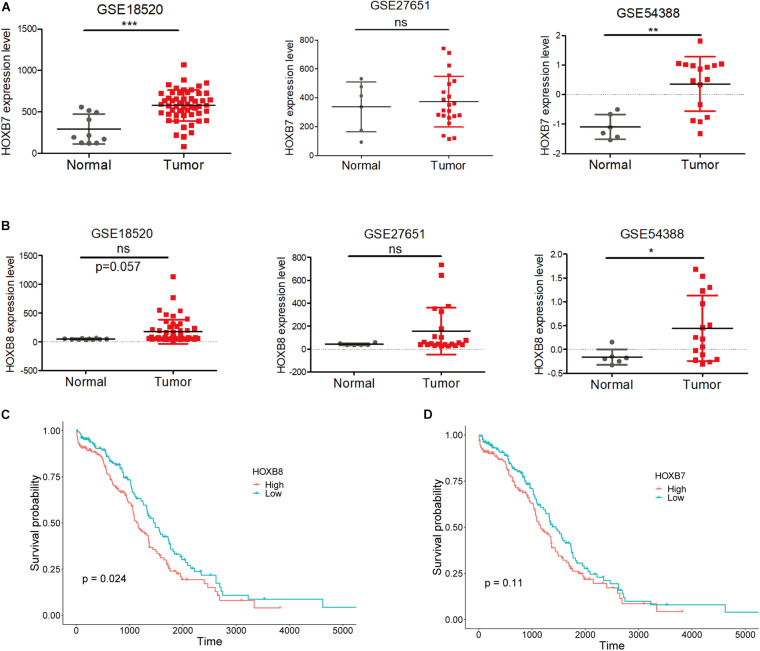
FIGURE 3.
Expression and survival analysis for HOXB7 and HOXB8. (A,B) Expression levels of HOXB7 (A) and HOXB8 (B) in three GEO datasets. (C,D) Overall survival analysis for EOC patients in the TCGA database was based on the expression of HOXB8 (C) and HOXB7 (D) expression from TCGA data. Median expression was used to stratify the high and low expression groups. ns: not significant, *p < 0.05, **p < 0.01, ***p < 0.001 as determined by an unpaired, two-tailed Student’s t-test.

