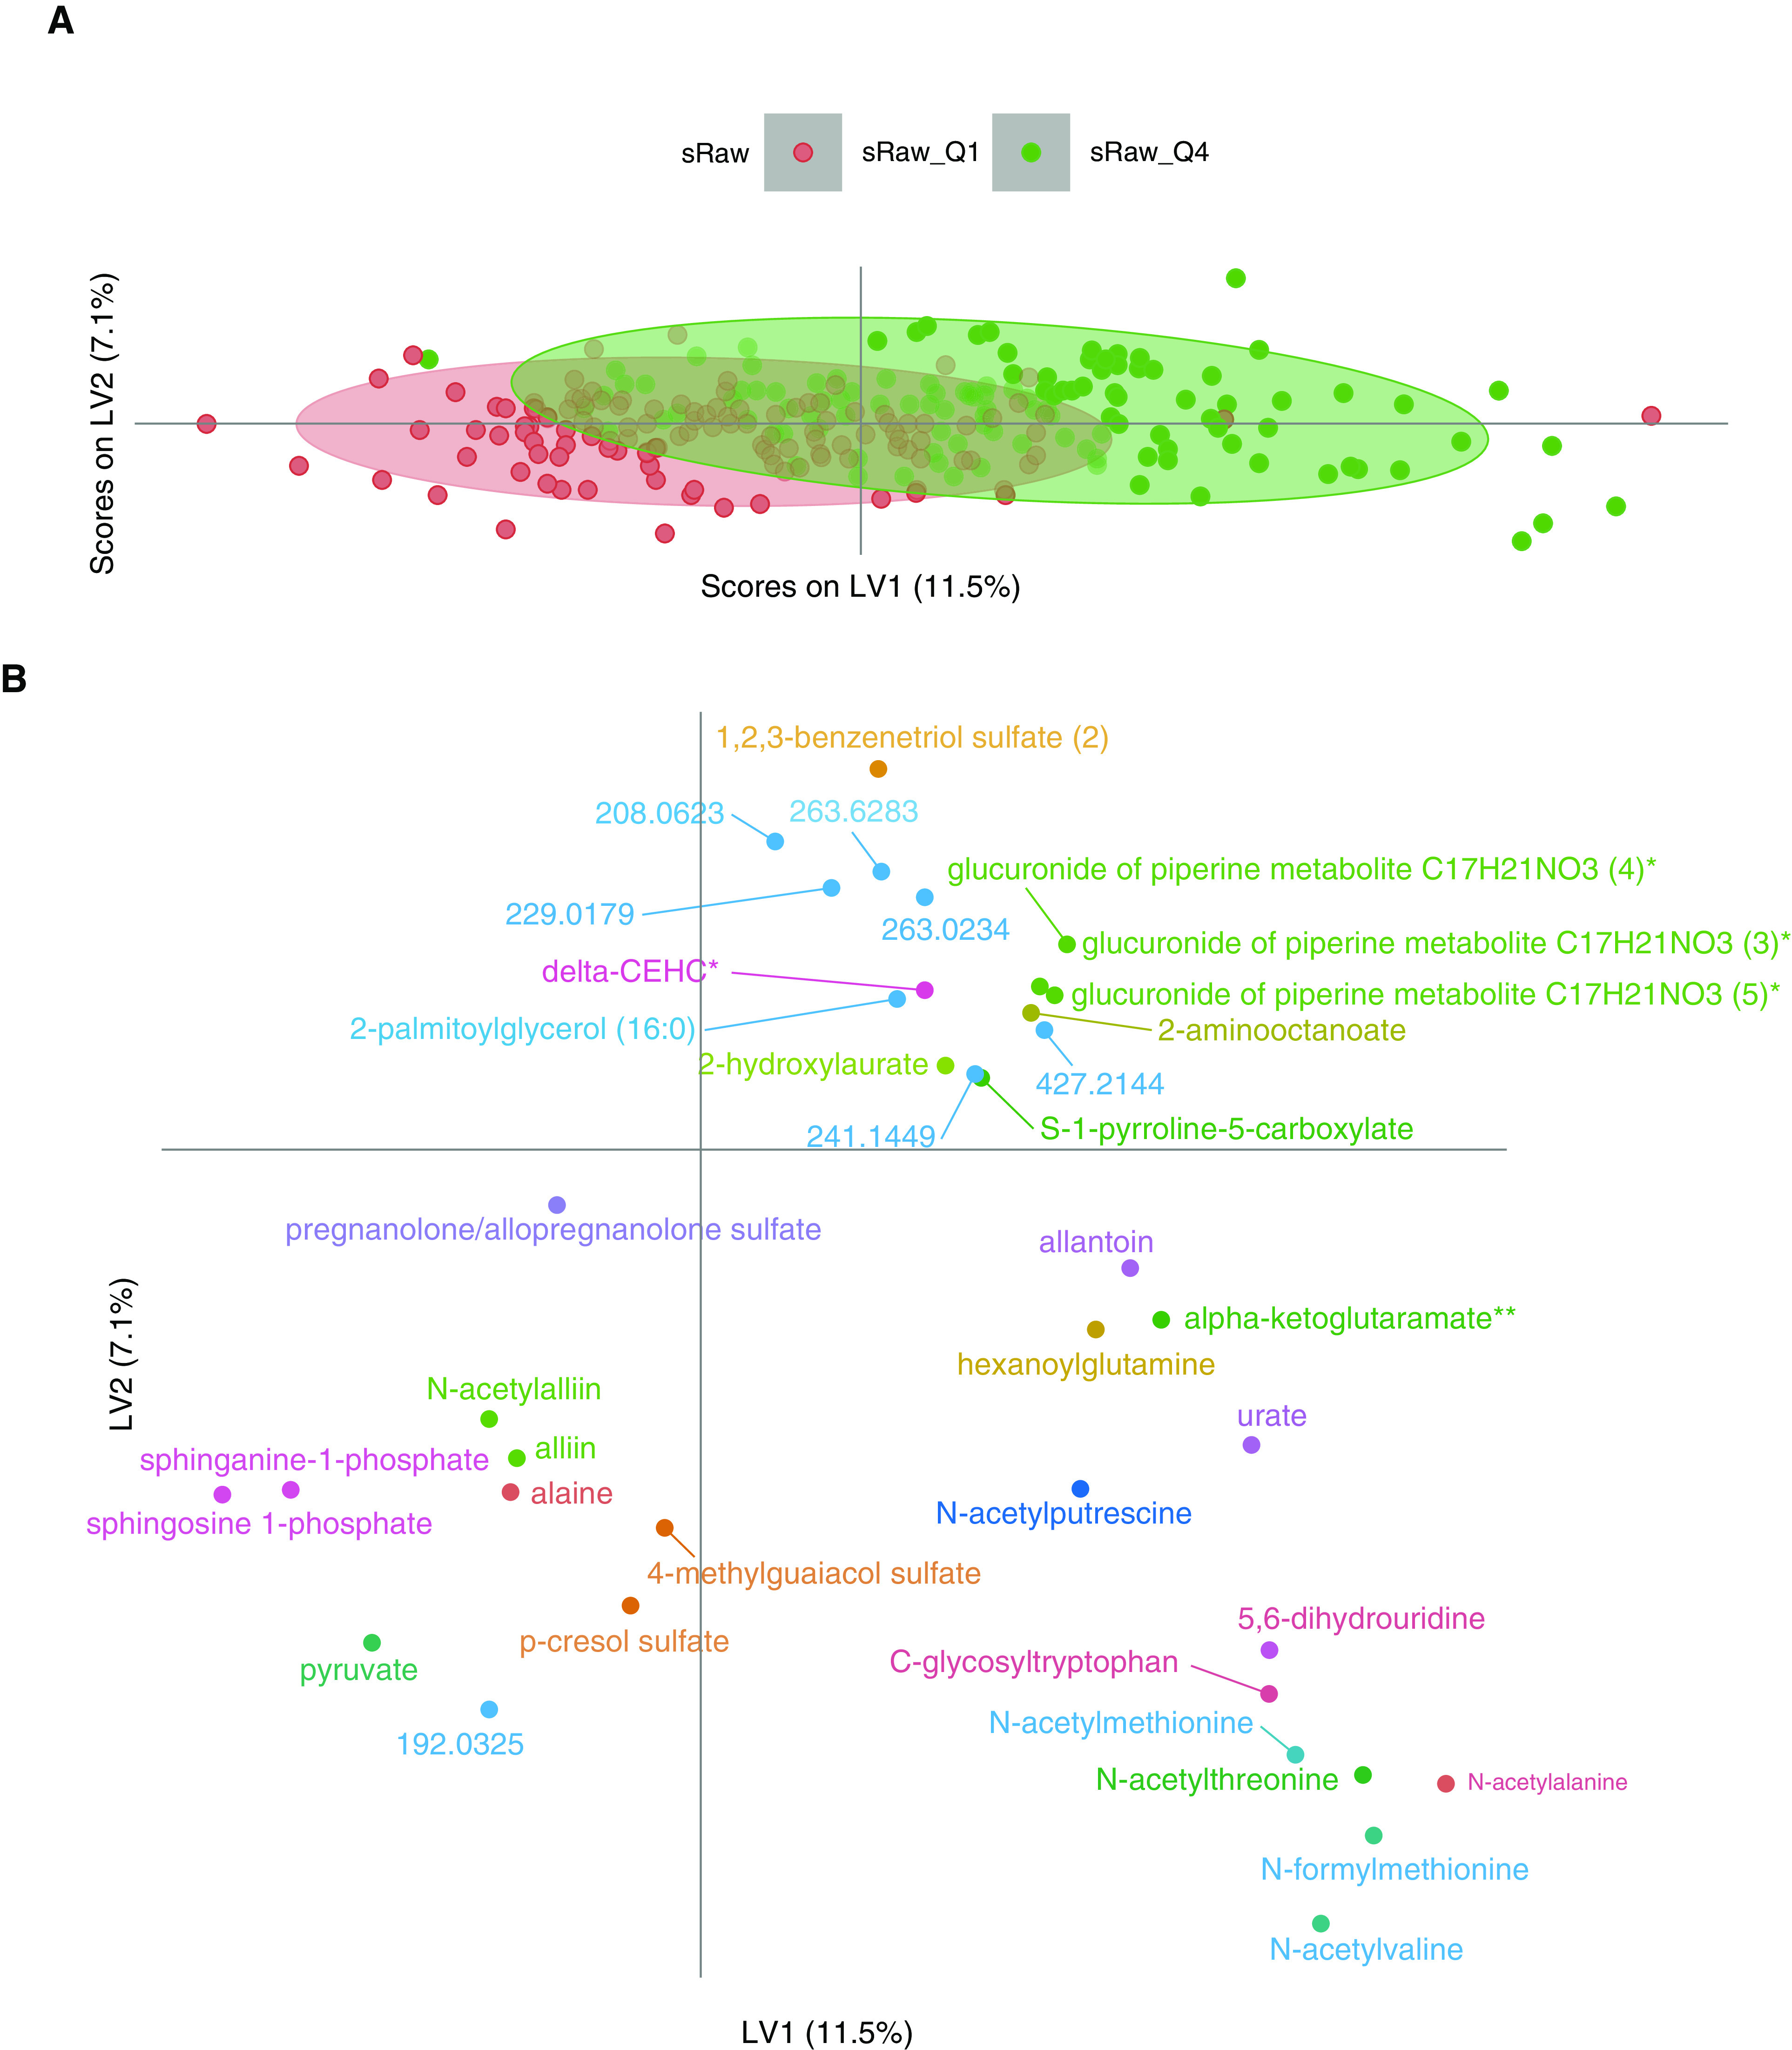
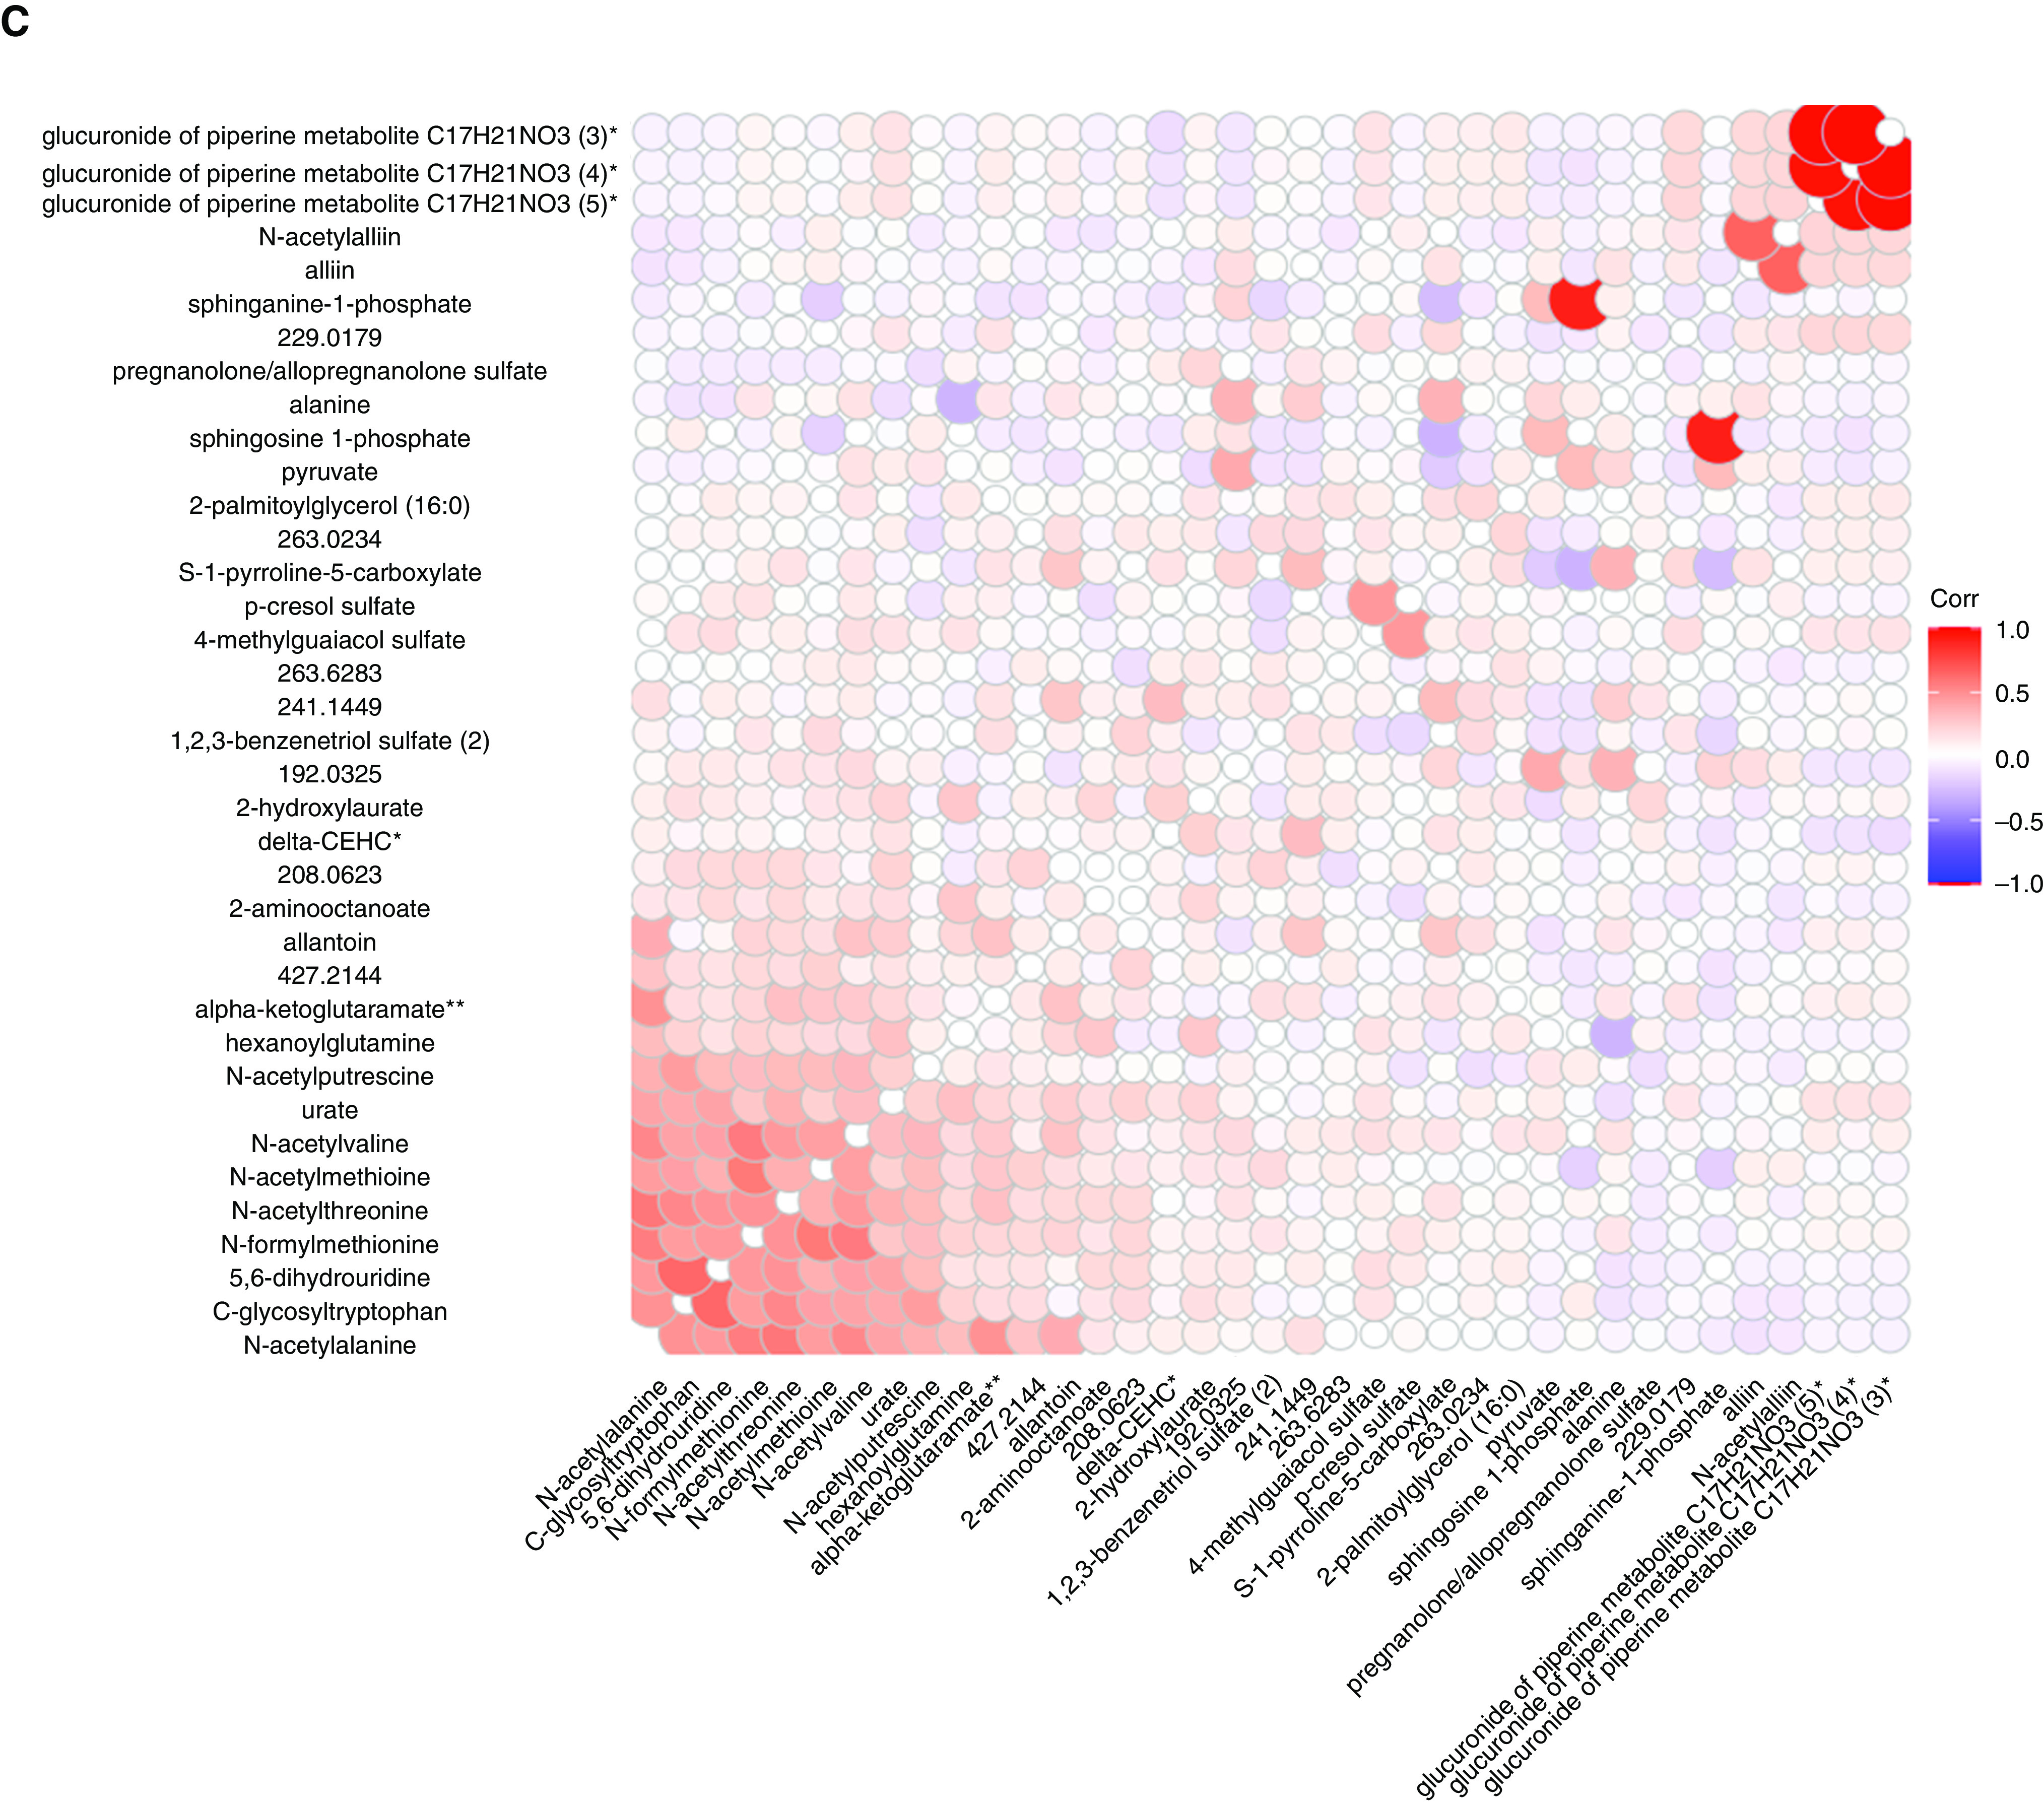
Figure 2.


Partial least squares discriminant analysis of the metabolome at the age 6 years versus the sRaw at the age of 6 years. (A) Scores plot. (B) Loadings plot. (C) Spearman Corr map of the metabolites at the age of 6 years selected in the partial least squares discriminant analysis model. Corr = correlation; delta-CEHC = C14H18O4; LV = latent variable; Q = quartile; sRaw = specific airway resistance.
