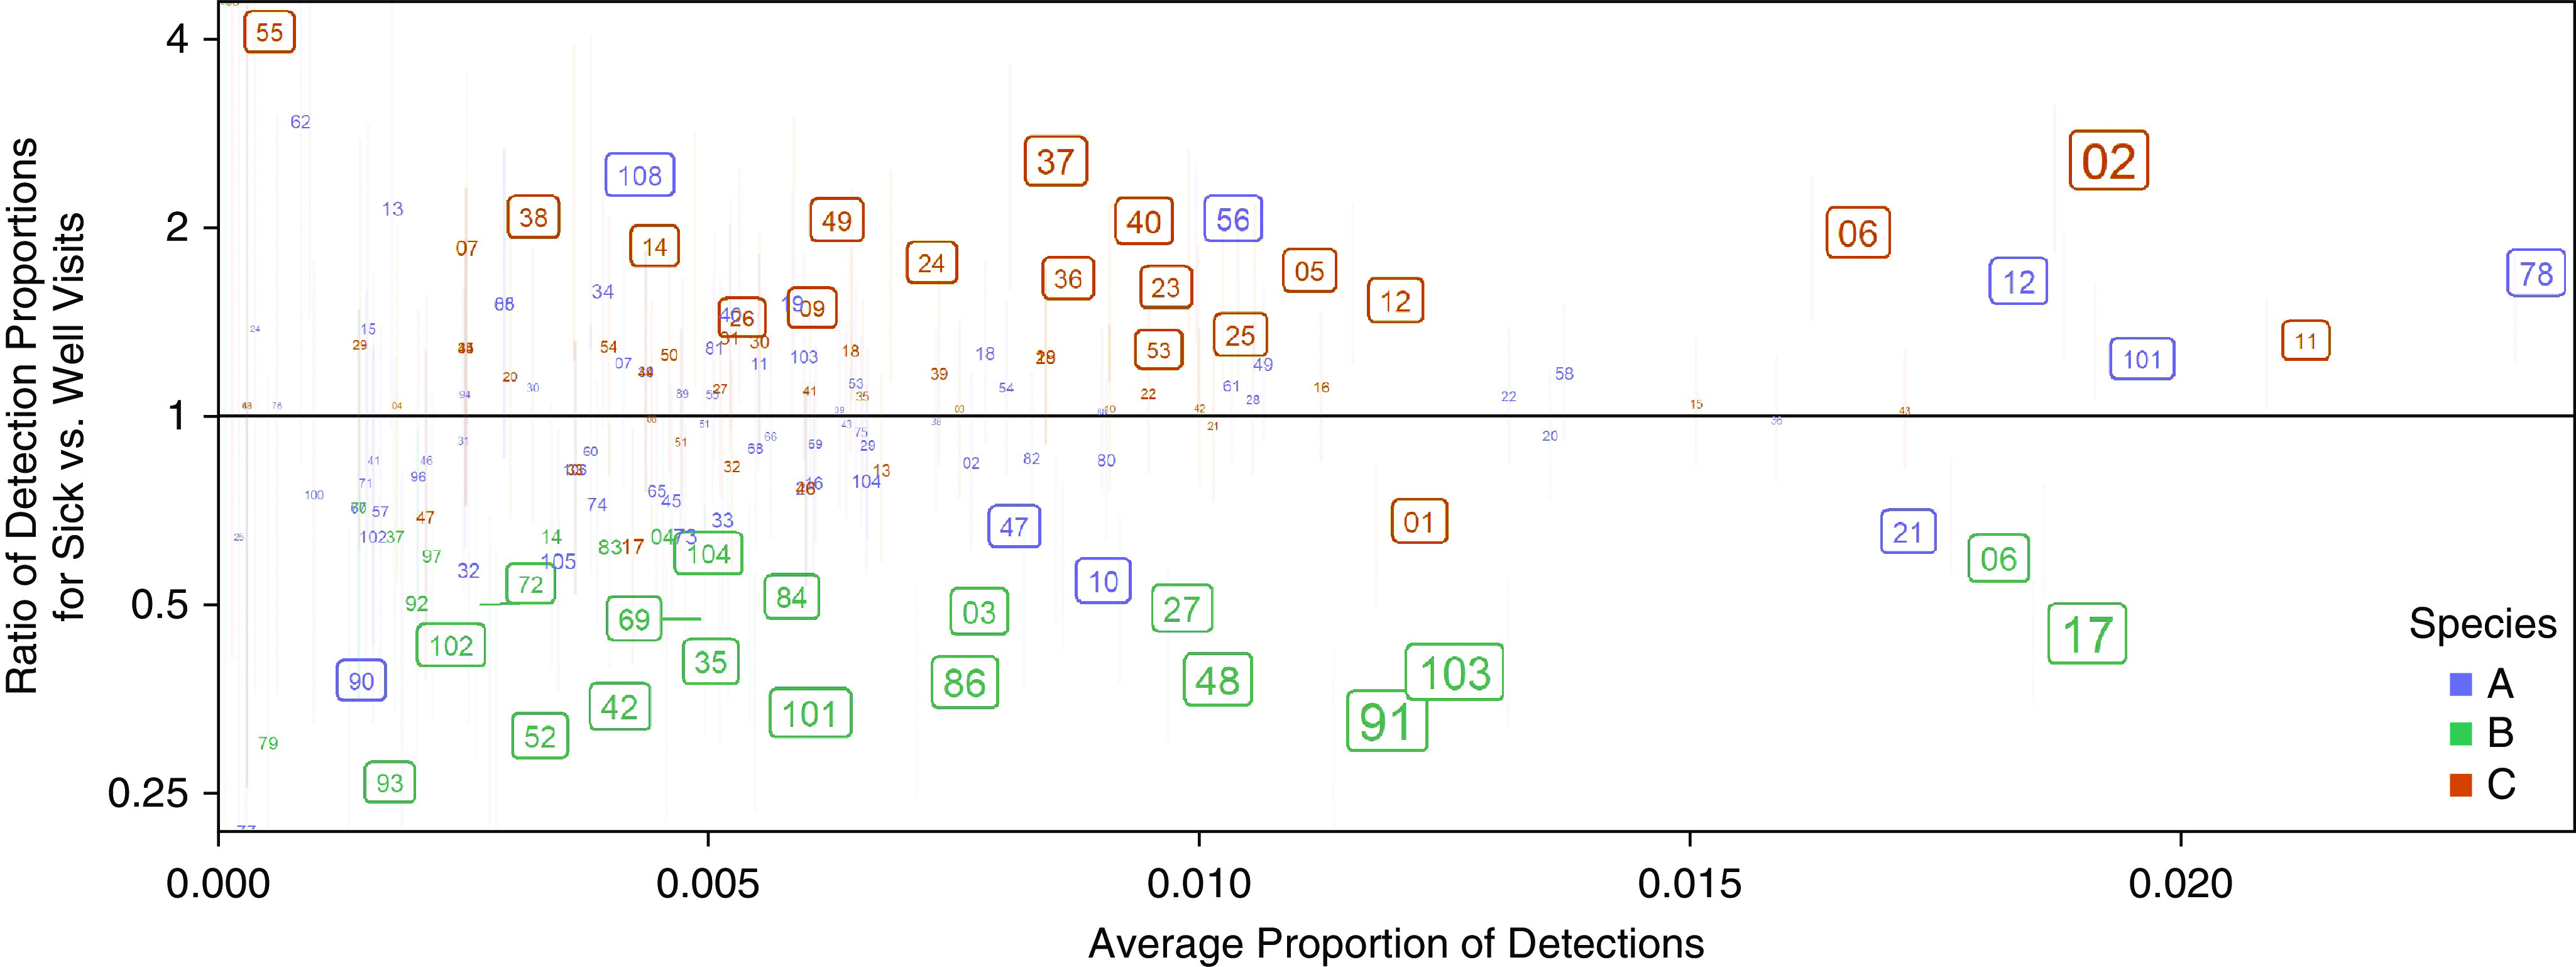
Figure 3.

Frequency of detection for each rhinovirus type and ratio of detection proportions for sick versus well visits in the pooled dataset. The species is color coded, and individual types are numbered within each species. The size of the numbers is proportional to the negative logarithm of the P value, and numbers in boxes are significant at the 5% level (unadjusted for multiple comparisons). Error bars (vertical lines) represent 95% confidence intervals for the ratio of detection proportions. Horizontal lines point at error bars for numbers that were scattered from them in congested areas to avoid overlapping.
