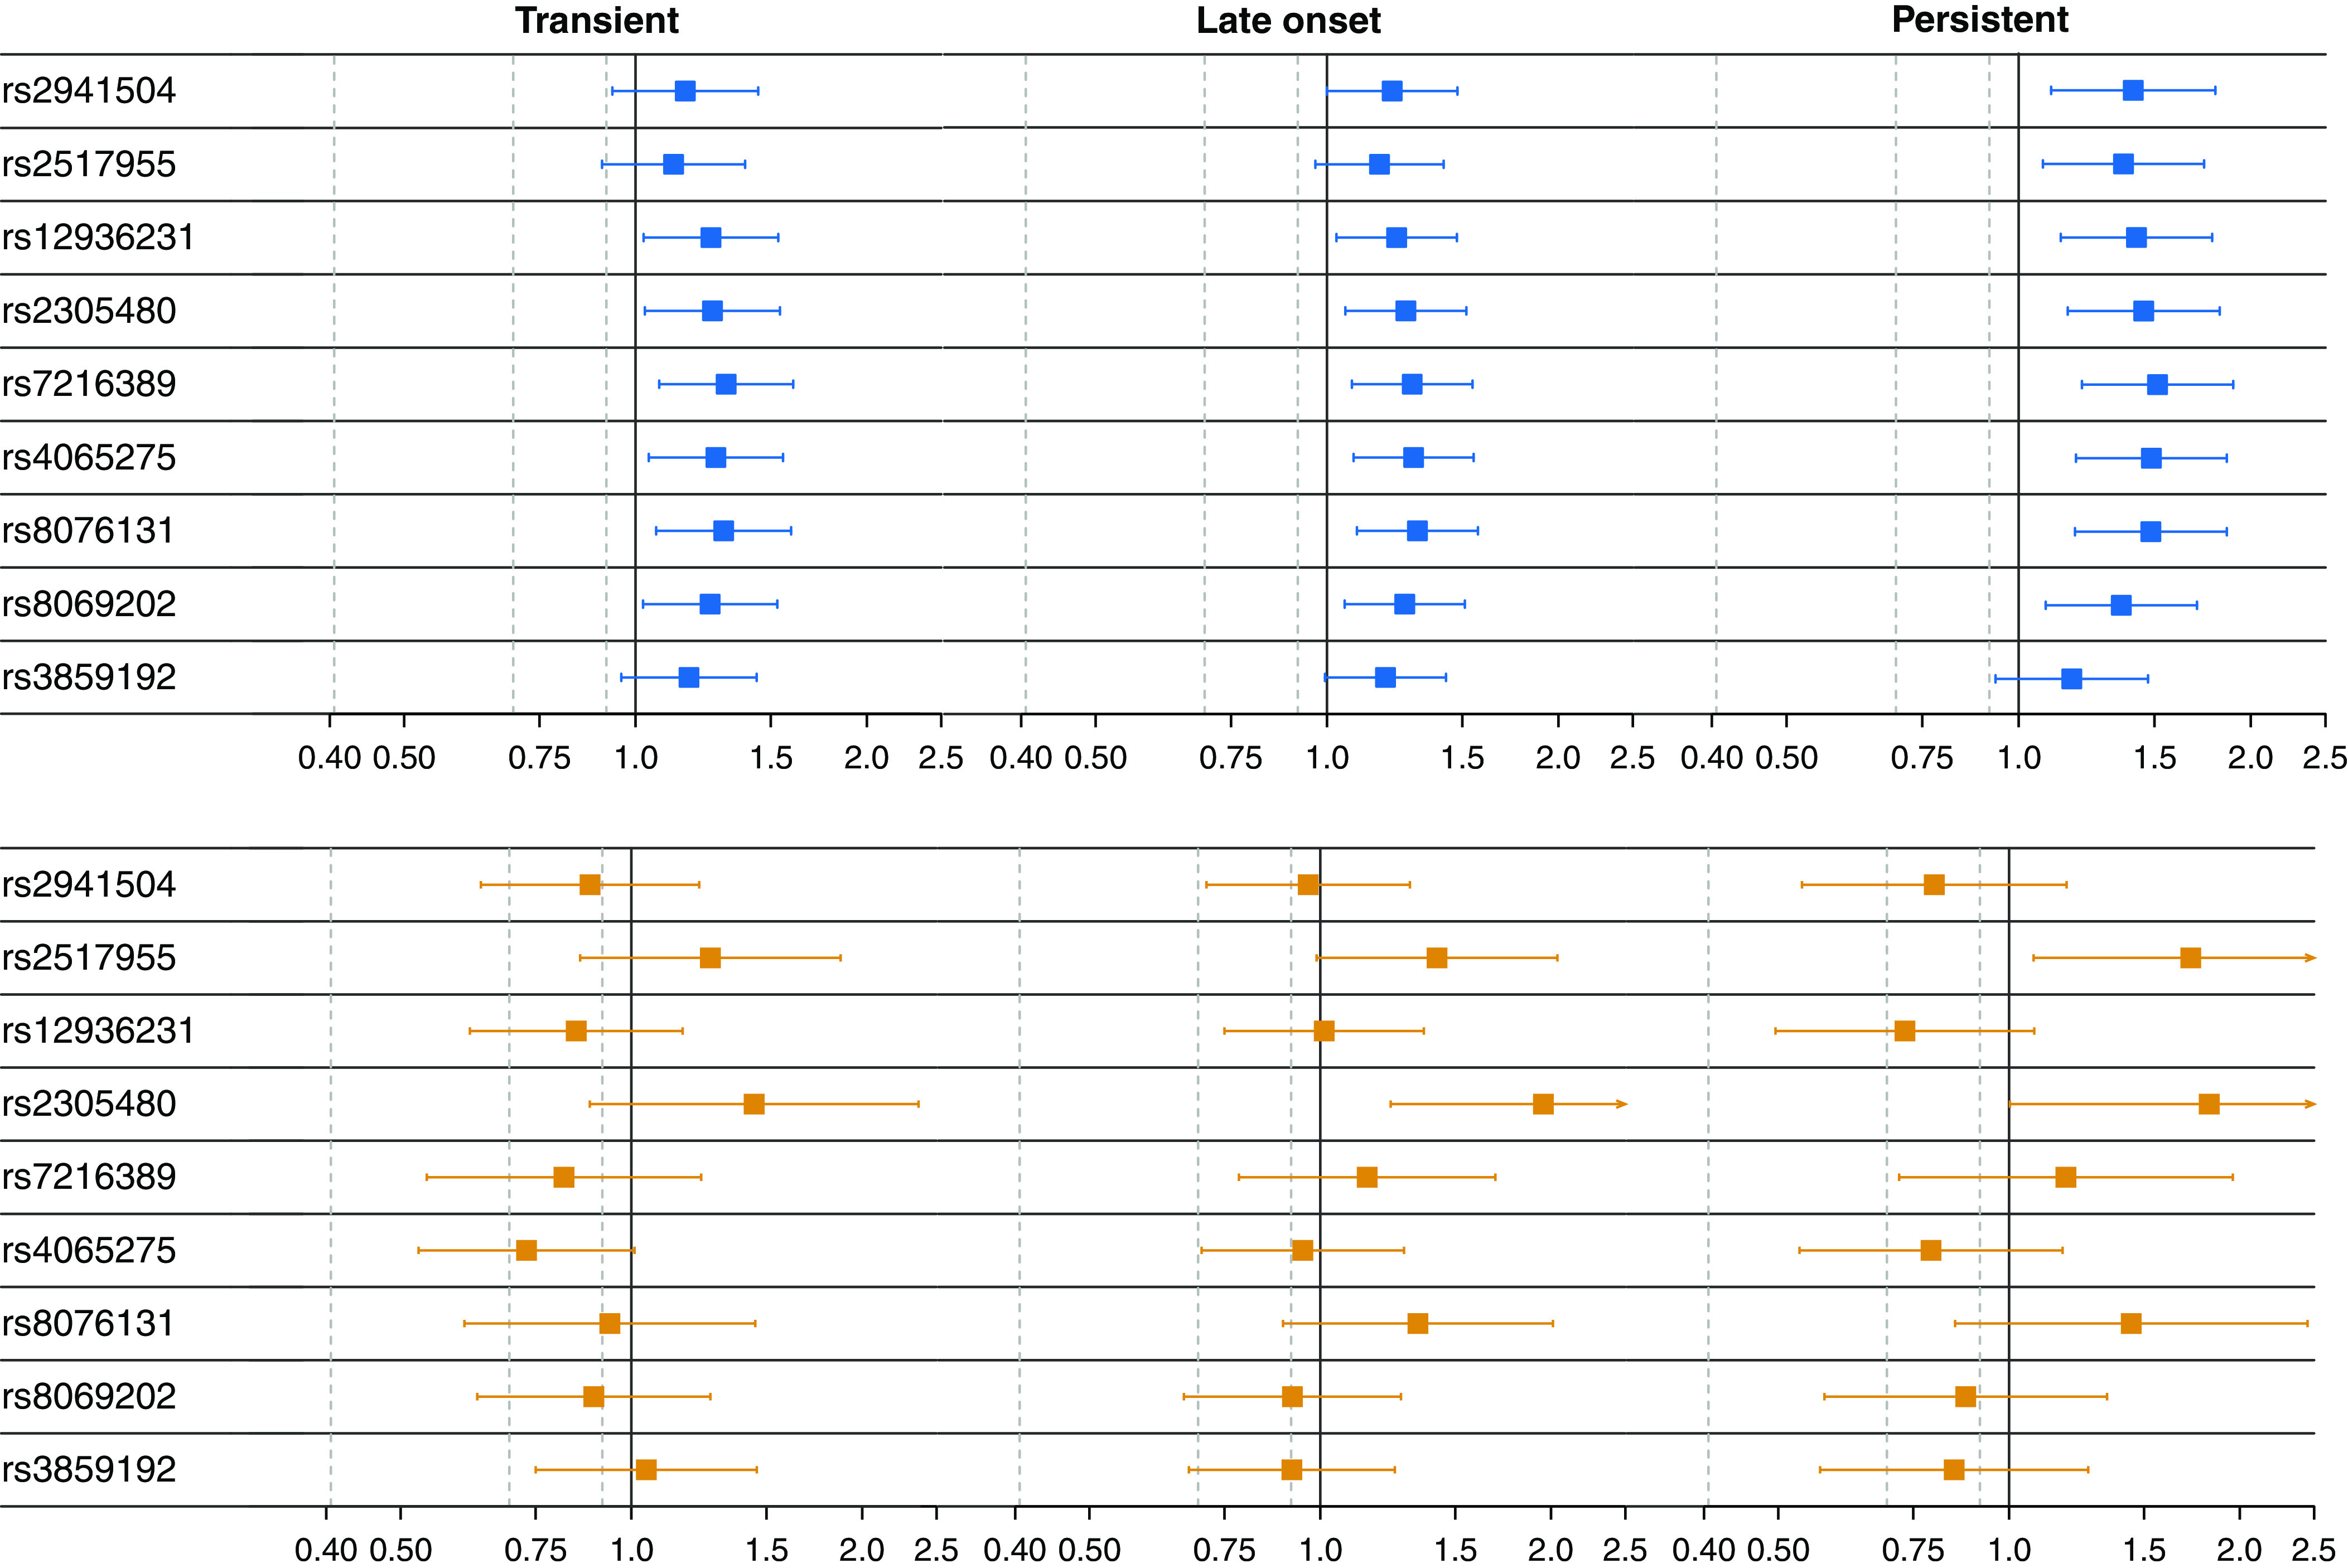
Figure 2.

Associations between wheezing phenotypes and SNPs in the 17q12-21 region for European American (EA) (n = 1,308) and African American (AA) (n = 620) children. The panels show the estimated odds ratios on a log scale for being in the three latent wheezing classes (persistent, late onset, or transient) versus the infrequent class by SNP, separately for EA (top, blue) and AA (bottom, orange). Here, an odds ratio greater than one indicates that having the risk allele (see Table E2) was associated with higher odds of belonging to the latent wheezing class relative to the infrequent class. The bars illustrate the 95% confidence intervals. A small arrow at the end of a confidence interval indicates that the interval continues to the right but was cut off for visualization.
