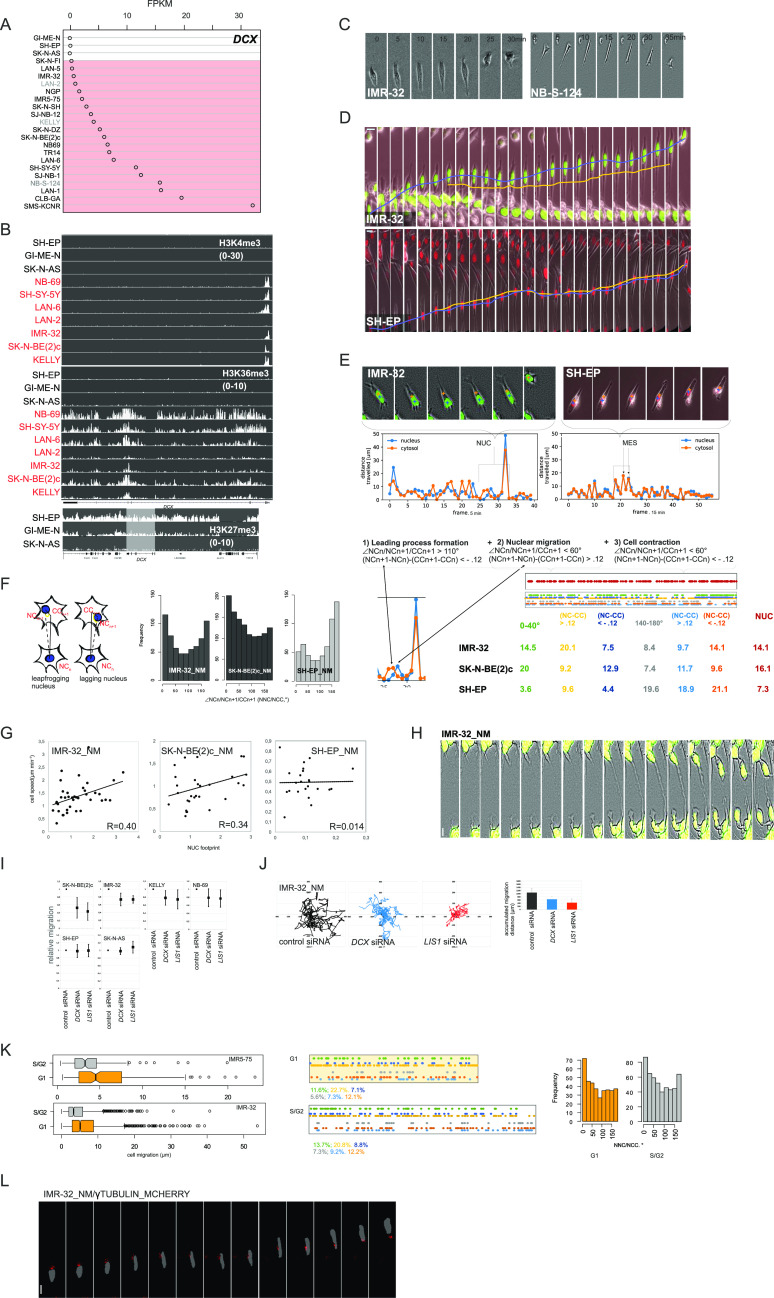
Figure 1. NB cells exhibit NUC during migration.
(A) DCX mRNA expression in MES and ADRN (marked in red) cell lines (the names of ADRN cell lines whose identity was assigned based on the phenotype and/or PHOX2b, GATA3, and FOSL2 transcription are represented in grey color [Fig S1A], the cell type identity in the other cell lines [black color] is described in the literature). (B) ChIP-seq showing H3K4me3, H3K36me3, and H3K27me3 binding at the DCX locus in three MES and ADRN (marked in red) cell lines. For H3K27me3 binding, the region surrounding DCX locus (white box) was visualized in IGV program. (C) Time-lapse images showing migrating NB-S-124 and IMR-32 cells. (D) Time-lapse images of IMR-32_NM and SH-EP_NM cells during migration. Nuclear (in blue) and cellular center (in orange) of migrating cells are indicated. Scale bar 20 μm. (E) CN trajectories and CN plots of representative IMR-32_NM and SH-EP_NM cells. (F) Schematic of nuclei positioning determined by NCn+1-NCn/|NCn+1-CCn+1 angle (NNC/NCC) (left) and NNC/NCC angle frequency distribution in IMR-32_NM, SK-N-BE(2)c_NM, and SH-EP_NM cells (right). NUC events decoded from CC; nuclear centroid tracks in concatenated tracks from IMR-32_NM, SK-N-BE(2)c_NM, and SH-EP_NM (top right). Mapping of NUC (exemplary track in red), positive and negative noise-corrected NC-CC distances, 0–40° and 130–180° signatures (two or more sequential frames within the same angle block) (exemplary multi-colored track) in concatenated tracks from IMR-32_NM, SK-N-BE(2)c_NM and SH-EP_NM (bottom right). (G) Correlation plots between cell velocity and NUC footprint (weighted mean NUC distance) in IMR-32_NM, SK-N-BE(2)c_NM and SH-EP_NM cells. (H) Live imaging of pseudo-3-D-assayed IMR-32_NM cells. Scale bar 10 μm. (I) 2D exclusion assay in NB cell lines after RNAi against DCX or LIS1 72 h post-transfection. Relative cell migration is quantified by cell density’s normalization to control siRNA-transfected control. Graphs represent the mean relative difference migration ± SD. (J) Random walk plots and accumulated migration distances in control IMR-32_NM cells and after RNAi against DCX or LIS1 72 h post-transfection (13 h, 15-min intervals). Mean migration distances + SD are presented. (K) Box plots showing cell migration distances in 216 and 1,528 (G1 phase), 167 and 985 (S/G2 phases) sequential timepoints (20 and 5 min per timepoint, respectively) from tracings of 13 cells from IMR5-75 and 22 cells from IMR-32 expressing the G1 cell cycle sensor (left); P-values: IMR5-75: 6.168 × 10⁻⁵, IMR-32: 2.2 × 10⁻¹⁶ (two-sample Kolmogorov-Smirnov test). NNC/NCC angle frequency distribution and noise-corrected nuclear centroid-CC distances (right) in 0–40° and 140–180° signatures in concatenated tracks from IMR-32_NM expressing the G1 cell cycle sensor. (L) Time-lapse images showing representative migrating IMR-32_NM expressing γ-tubulin. Scale bar 20 μm.

