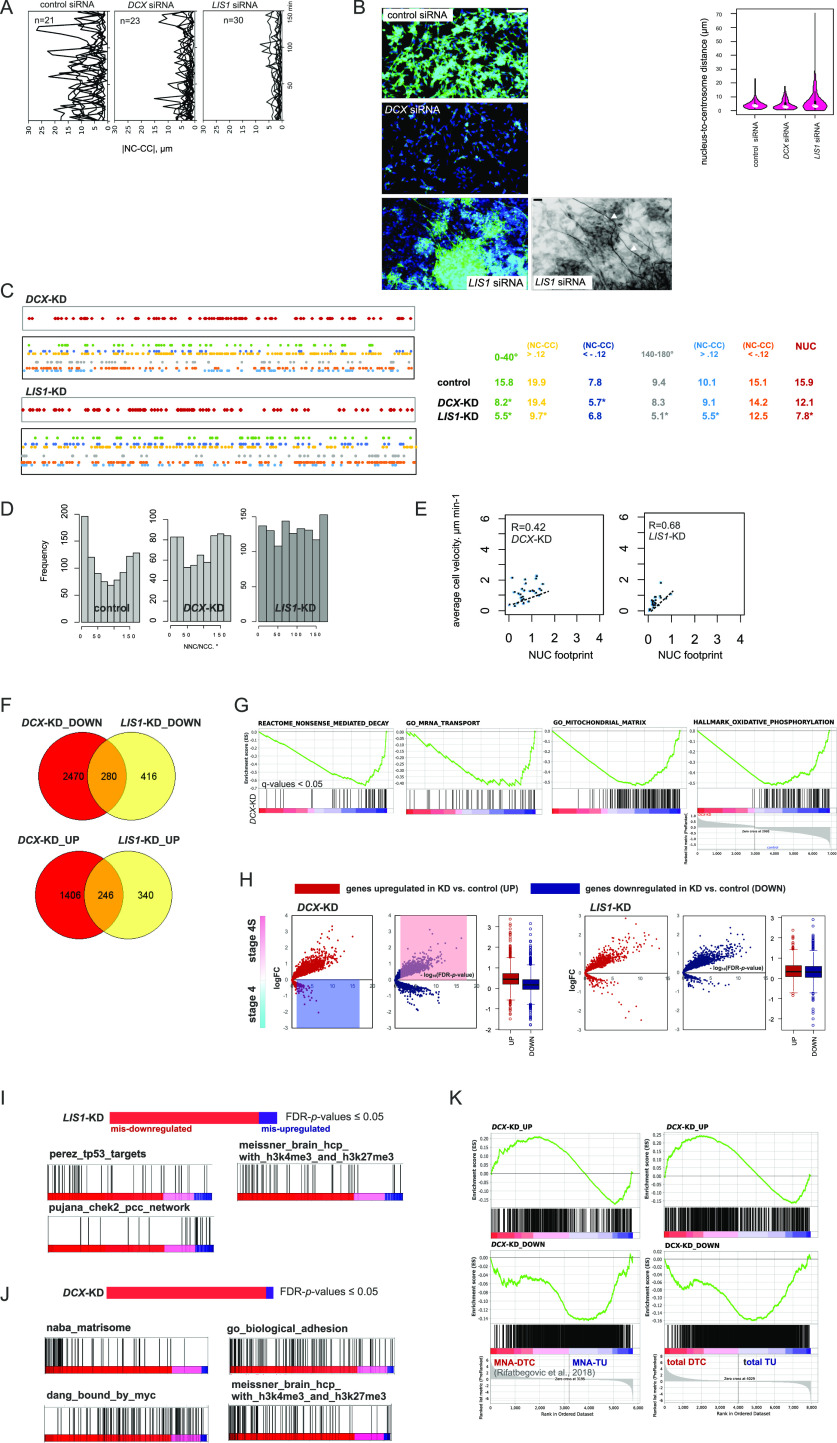
Figure 2. NUC genes are involved in migration in ADRN-type cells.
(A) |NC-CC| plots for control IMR-32_NM cells and the cells after DCX- or LIS1-KD 72 h post-transfection. (B) βIII-tubulin immunolabeling (top left) in control IMR-32 cells and after RNAi against DCX and LIS1 72 h post-transfection. Neurite outgrowth after LIS1 RNAi (bottom left; grayscale negative field) is indicated by white arrows. Scale bar 100 μm. Violin plots showing the nucleus-to-centrosome distance distribution in DCX- and LIS1-KD IMR-32 cells (right). Means are indicated. P-values: DCX siRNA: 0.009898, LIS1 siRNA: n.s.; (Welch t test). (C) Mapping of NUC, positive and negative noise-corrected NC-CC distances, 0–40° and 140–180° signatures in concatenated tracks from DCX-KD (27 cells, 762 time points) and LIS1-KD (41 cells, 1,256 timepoints) IMR-32_NM. (D) NNC/NCC angle frequency distribution in concatenated tracks in DCX- and LIS1-KD IMR-32_NM cells. (E) Correlation plots between cell velocity and NUC footprint in DCX- and LIS1-KD IMR-32_NM cells. (F) Venn diagram showing overlaps between the differentially expressed genes (DEGs; |logFC| cutoff: 0.3) in DCX- and LIS1-KD IMR-32 versus control IMR-32. (G) Gene set enrichment analysis plots of the indicated gene sets in DCX-KD IMR-32. False discovery rate (FDR)-adjusted P-values (q-values) are listed. (H) Volcano plots showing log2FC expression (y-axis) and log10 FDR-adjusted P-value (−log10 FDR-P-value, x-axis) of DEGs in DCX- and LIS1-KD IMR-32 in stage 4S versus stage 4 tumors (GEO: gse49710). Each dot represents an individual spot. (I, J) Gene set enrichment analysis plots of the indicated gene sets in LIS1- and DCX-KD IMR-32 based on their mis-expression in stage 4S versus stage 4 tumors (P-values by two-way t test ≤ 0.05, no logFC cutoff). (K) Plots showing mapping of DEGs of DCX-KD IMR-32 onto NB disseminated tumor cell transcriptome profiles (Rifatbegovic et al, 2018).

