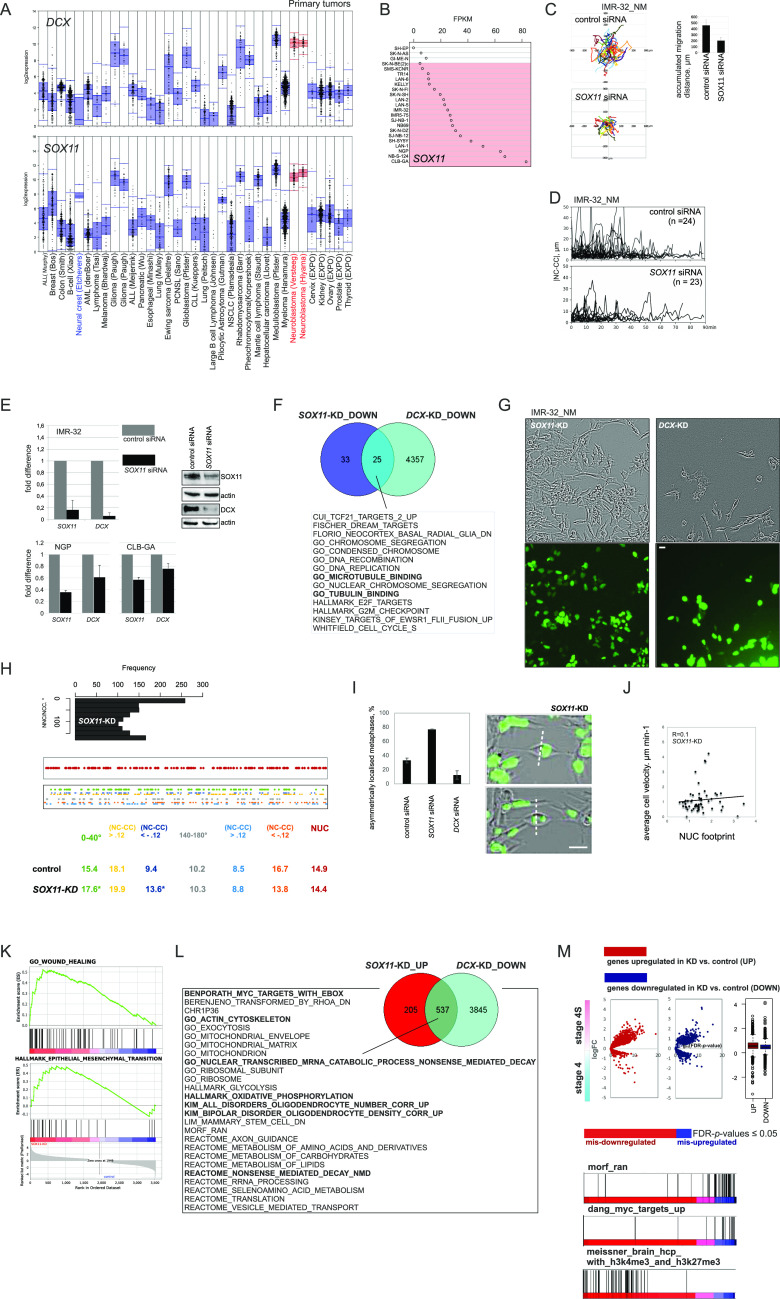
Figure 3. SOX11 regulates NUC.
(A) Affymetrix DCX mRNA (probe set 229349, top) and SOX11 mRNA (probe set 204914, bottom) expression analysis from primary tumors. (B) SOX11 mRNA expression in MES and ADRN (marked in red) cell lines. (C) Random walk plots and accumulated migration distances in control IMR-32_NM and after RNAi against SOX11 72 h post-transfection (6 h, 15-min intervals). Mean migration distances + SD are presented. The efficiency of SOX11-KD was determined by WB. (D) Representative |NC-CC| plots in IMR-32_NM controls and after RNAi against SOX11. (E) Relative qRT-PCR for SOX11 and DCX in IMR-32 after SOX11 RNAi 72 h post-transfection and in NGP and CLB-GA after SOX11 RNAi 48 h post-transfection (left). Mean relative difference values + SE of control are presented. WB for DCX in IMR-32 after 48 h post-transfection (right). (F) Venn diagram showing the number of gene sets (extracted from MSigDB [22,596 gene sets]) in IMR-32 DCX-KDDOWN ∩ SOX11-KDDOWN semantic overlap (q-values ≤ 0.05). (G) Cell morphology in SOX11-and DCX-KD cells. Scale bar 20 μm. (H) NNC/NCC angle frequency distribution (top) and mapping of NUC, positive and negative noise-corrected NC-CC distances, 0–40° and 140–180° signatures (bottom) in SOX11-KD (57 cells, 1,314 timepoints). (I) The percentages of asymmetrically localised metaphases (left) in control, SOX11- and DCX-KD IMR-32_NM. Mean percentages + SD are presented. Representative images of dividing SOX11-KD cell (right, scale bar 20 μm). (J) Correlation plot between cell velocity and NUC footprint (weighted mean NUC distance) in SOX11-KD IMR-32_NM. (K) Gene set enrichment analysis plots showing gene sets “wound healing” and “epithelial–mesenchymal transition” in SOX11-KD versus control. (L) Venn diagram showing the number of gene sets (MSigDB) in IMR-32 SOX11-KDUP ∩ DCX-KDDOWN semantic overlap (q-values ≤ 0.05). (M) Volcano plots showing expression of DEGs in SOX11-KD IMR-32 in stage 4S versus stage 4 tumors.

