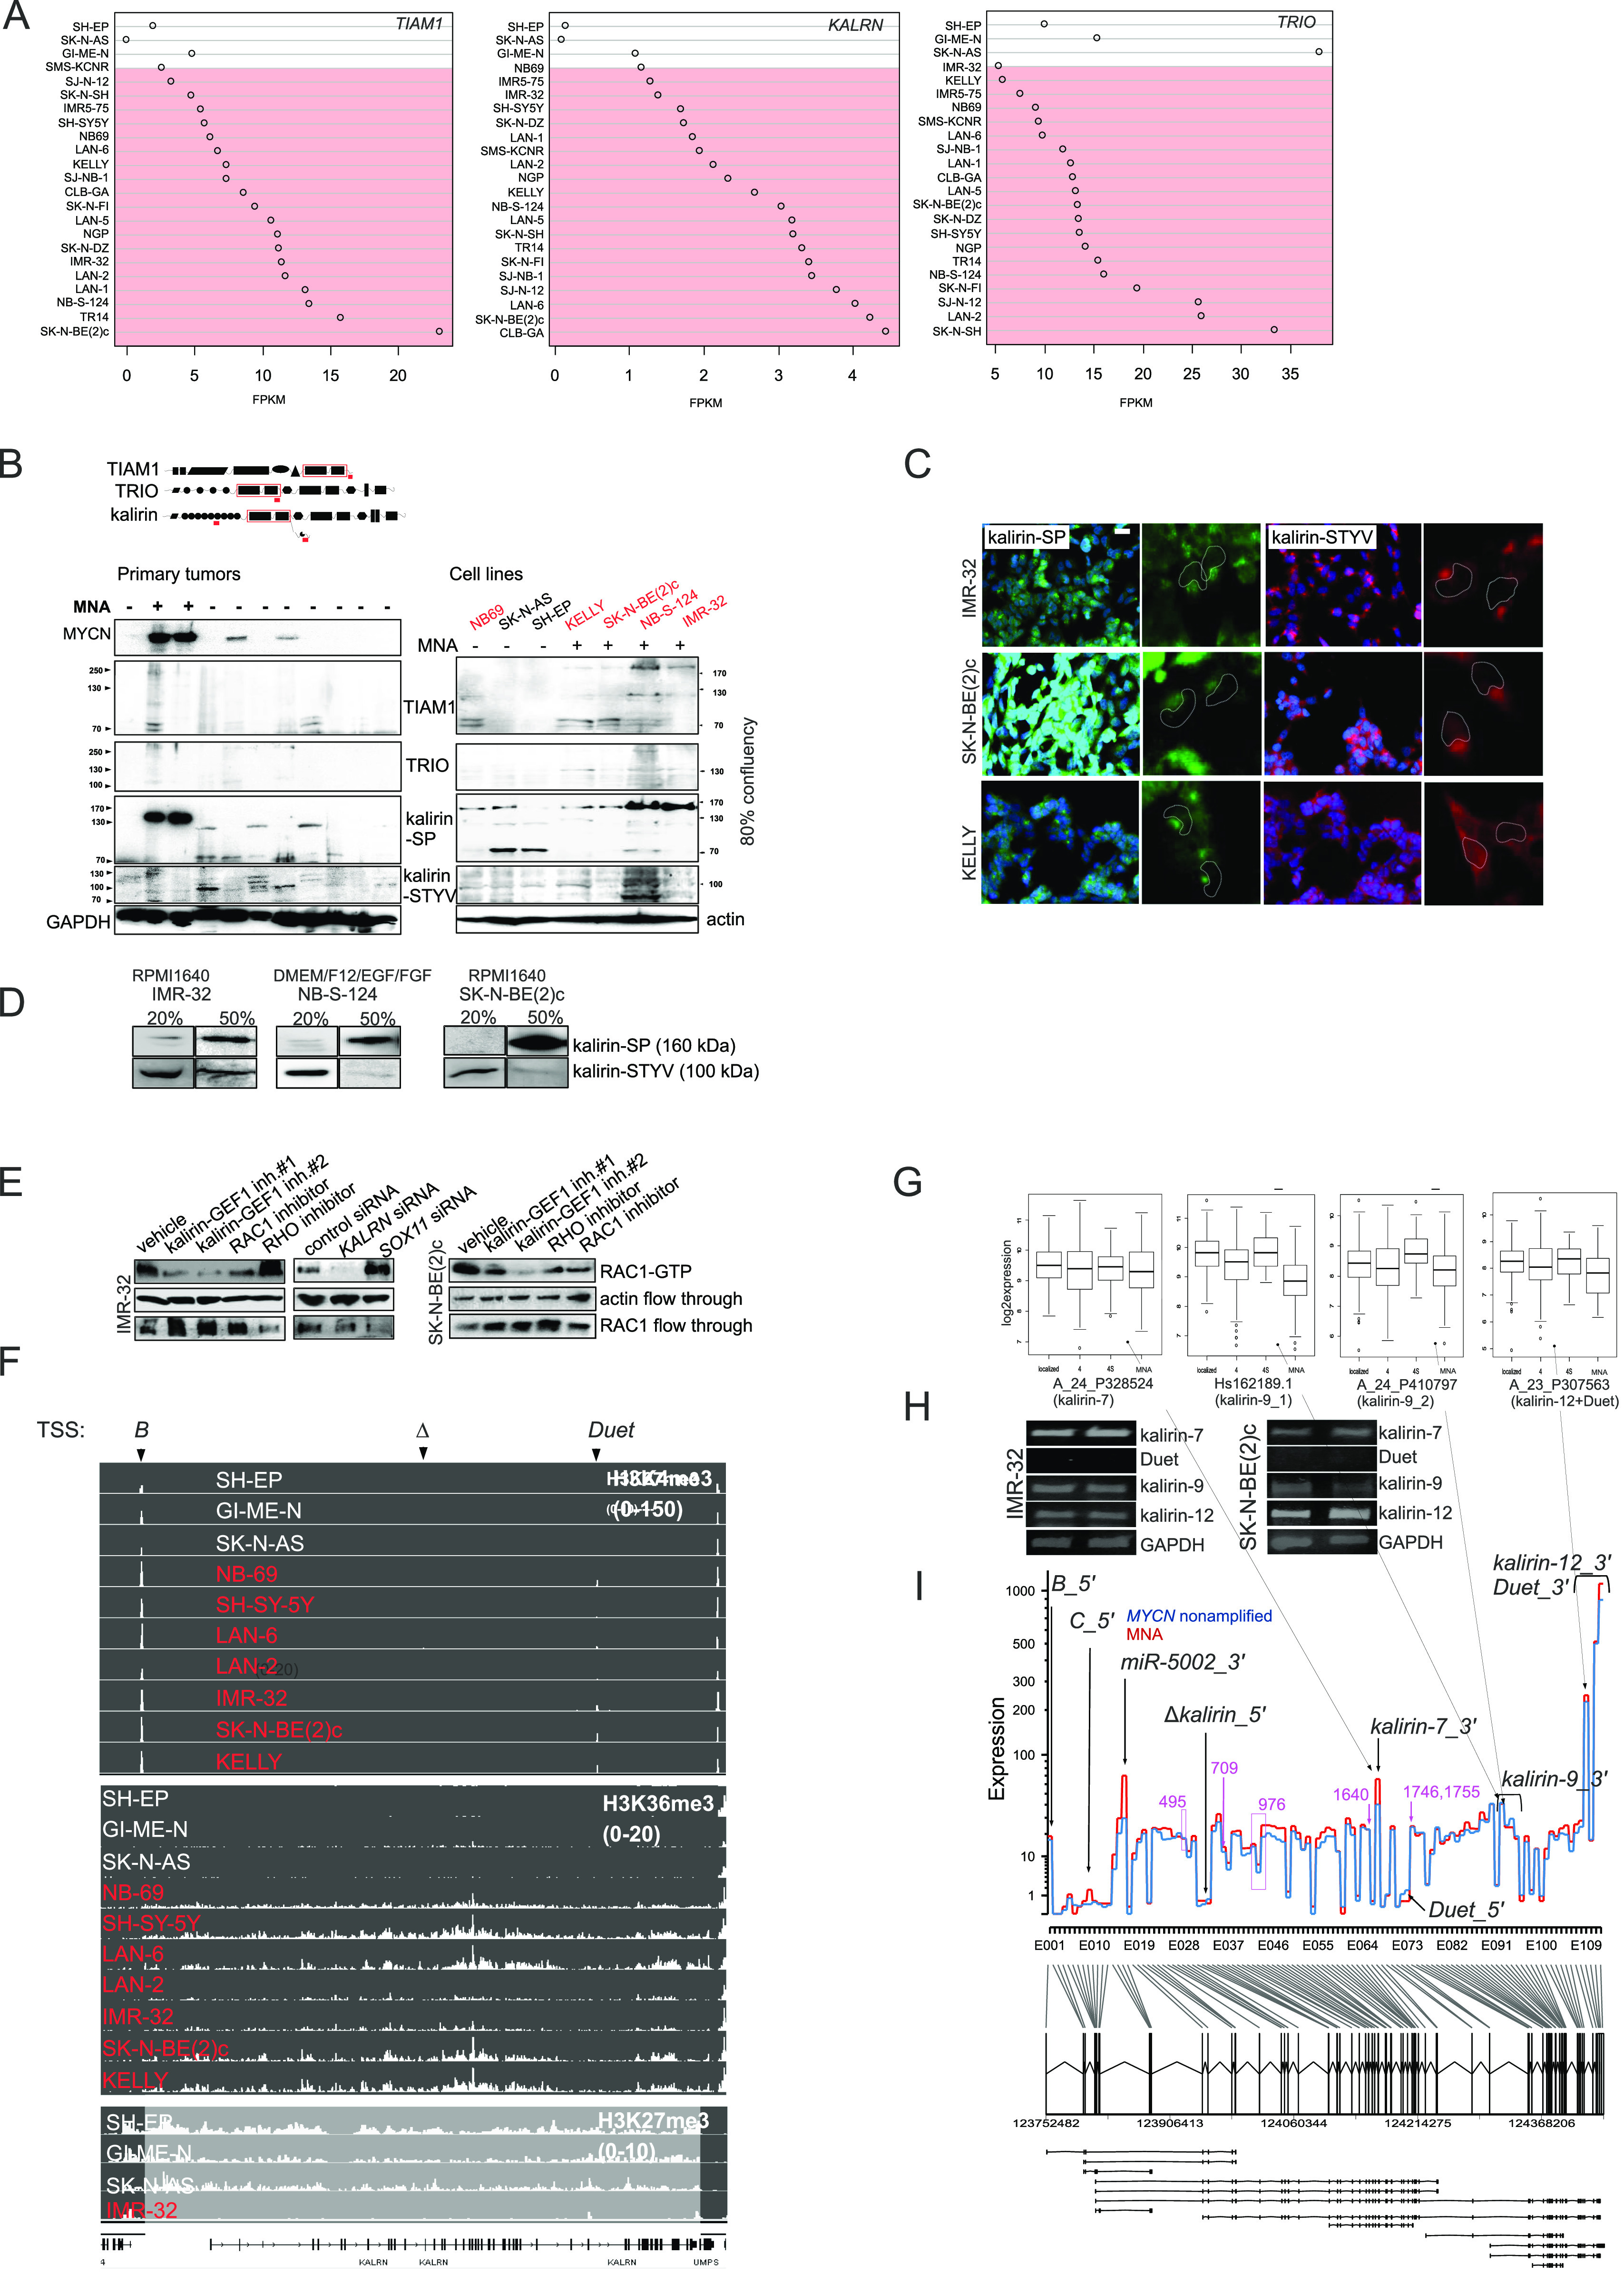
Figure 5. Kalirin is a NSC23766-sensitive RAC1-GEF in ADRN-type cells.

(A) TIAM1, KALRN, and TRIO mRNA expression in MES and ADRN (marked in red color) cell lines. (B) WB analysis of TIAM1, TRIO and kalirin in a panel of primary NBs, NB cell lines. Location of antigens and RAC1-GEF domains in TIAM1, TRIO, and kalirin proteins (top) is marked by red lines and boxes, respectively. MNA status in primary tumors and cell lines is indicated. The names of ADRN cell lines are marked in red color. (C) IMR-32, SK-N-BE(2)c, and KELLY were stained with anti-STYV and anti–kalirin–SP antibodies and visualized with Cy3- or Alexa 488–conjugated secondary antibodies. Nuclei are indicated by the dashed lines. (D) WB analysis of kalirin–SP and kalirin–STYV in MNA cell lines harvested at 20% and 50% confluency. (E) RAC1 activity in IMR-32 and SK-N-BE(2)c cell treated with kalirin–GEF1 inhibitor#1 (10 μM), kalirin–GEF1 inhibitor#2 (5 μM), RHOA inhibitor (3 μM), RAC1 inhibitor (10 μM), or after SOX11 and KALRN RNAi. The cell lysates were incubated with RBD–Rhotekin or PAK-PBD beads and the bound activated RHOA and RAC1 was analysed by Western blotting. Flow through fraction was analysed for RHOA and RAC1 expression as loading control. (F) H3K4me3, H3K36me3, and H3K27me3 ChIP-seq showing binding events at KALRN promoter and gene body in NB cell lines. ADRN cell lines are marked in red color. Arrows indicate transcription start sites. (G) Expression of kalirin isoforms in primary NBs. (H) RT-PCR for 3′-most exons of kalirin-7, kalirin-12, Duet and kalirin-9 in IMR-32 and SK-N-BE(2)c. (I) KALRN gene profile obtained from RNA-seq data analysis of 27 primary NBs. 5′-most exons, 3′-most exons of the isoforms are indicated, exons encoding known and high score calpain cleavage sites (predicted for the kalirin-12 [uniprot: O60229-1]) are marked in purple color.
