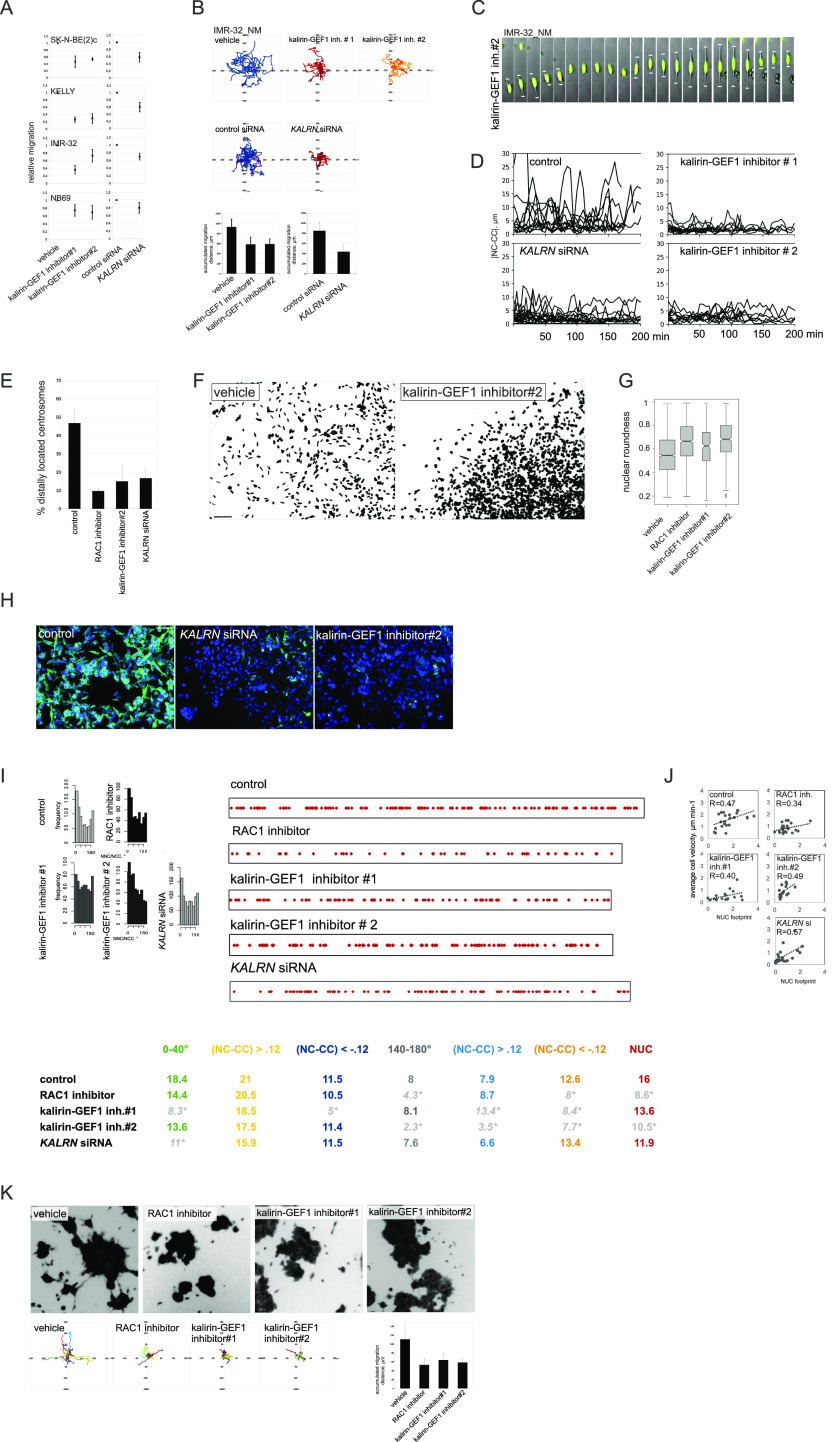
Figure 6. Kalirin inhibition hinders migration in MNA cells and perturbs cell polarisation and MT structure.
(A) Relative migration in 2D exclusion assay after treatment with vehicle, kalirin–GEF1 inhibitor#1 (10 μM) and kalirin–GEF1 inhibitor#2 (5 μM) or after KALRN RNAi. Relative cell migration is quantified via normalization of cell density to vehicle- or siRNA-treated control. Graphs represent mean relative difference in migration + SD. (B) Random walk plots and accumulated migration distances in control IMR-32_NM cell after treatment with kalirin–GEF1 inhibitor#1 or kalirin–GEF1 inhibitor#2, and after 48 h of KALRN RNAi (13 and 10 h, 15-min intervals). Mean values + SD are presented. (C) Time-lapse images of IMR-32_NM after kalirin–GEF1 inhibitor#2 treatment. Nuclei and leading processes are indicated. Scale bar 20 μm. (D) |NC-CC| plots in control IMR-32_NM and after treatment with kalirin–GEF1 inhibitor#2, kalirin–GEF1 inhibitor#1 or KALRN siRNA. (E) The percentage of centrosomes located distally in control, kalirin, or RAC1-suppressed IMR-32 cells. Mean values + SD are presented. (F) DAPI staining showing changes in the nucleus shape in IMR-32 after kalirin–GEF1 inhibition. (G) Box plots demonstrating nuclear roundness in IMR-32 cells treated with RAC1- or kalirin–GEF1 inhibitor. Data represent three independent experiments (819, 1,008, 375, and 772 cells). (H) βIII-tubulin staining in control IMR-32 cells and after treatment with kalirin–GEF1 inhibitor#2 or KALRN RNAi. The representative fields were photographed. Scale bar 100 μm. (I) NNC/NCC angle frequency distribution (left) and NUC and noise-corrected NC-CC distances in 0–40° and 140–180° signatures in concatenated tracks from control (25 cells and 866 cells), RAC1-inhibited (30 cells, 563 timepoints), kalirin–GEF1–inhibited (25 cells and 606 timepoints) and KALRN siRNA treated (30 cells and 860 timepoints) IMR-32_NM (right). (J) Correlation plots between cell velocity and NUC footprint in control IMR-32_NM and after treatment with RAC1 inhibitor, kalirin–GEF1 inhibitor#1, kalirin–GEF1 inhibitor#2, or KALRN siRNA. (K) Phase contrast images, random walk plots, and accumulated migration distances of randomly migrating cells treated with vehicle, RAC1 inhibitor (10 μM), kalirin–GEF1 inhibitor#1 (10 μM) or kalirin–GEF1 inhibitor#2 (5 μM) for 48 h in pseudo-3-D (21 h, 90-min intervals). Mean values + SD are presented.

