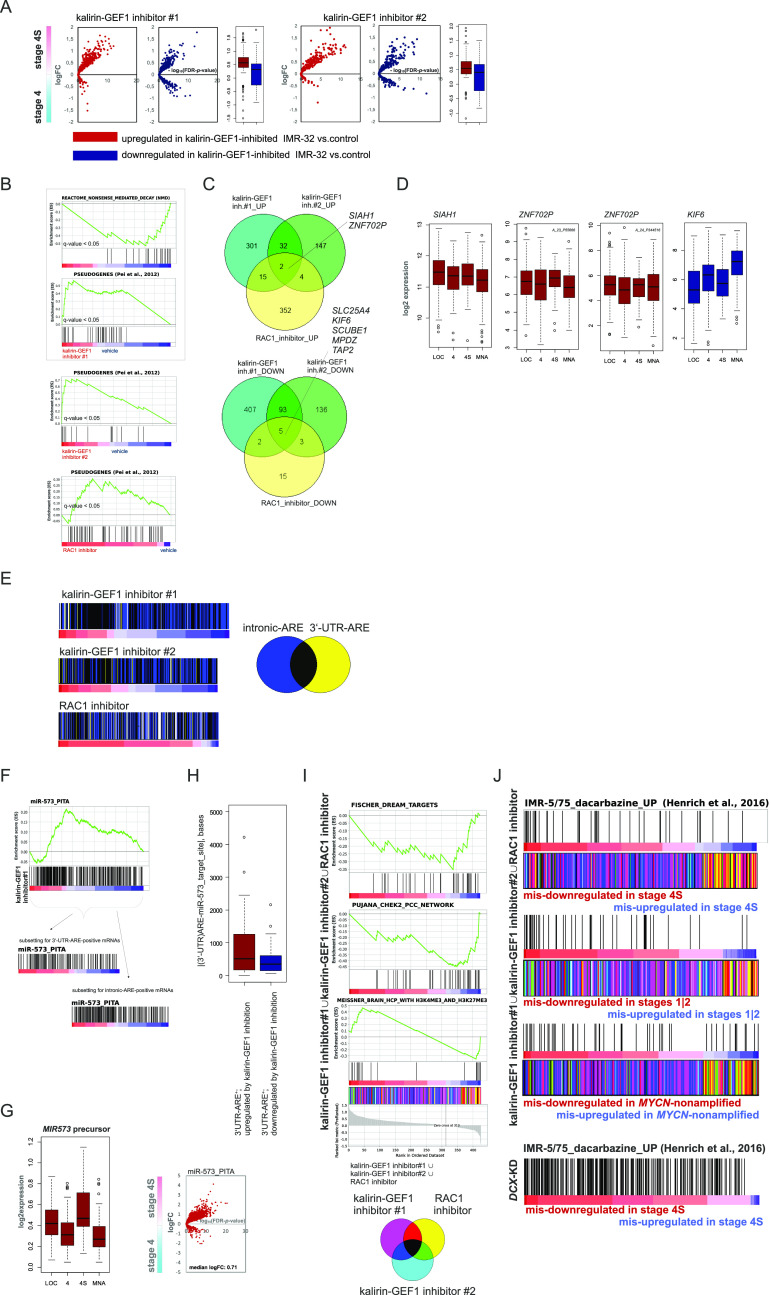
Figure 7. Inhibition of kalirin-GEF1 engages pathways of post-transcriptional gene regulation.
(A) Volcano plots showing expression of DEGs in kalirin–GEF1–inhibited cells versus control in stage 4S versus 4 tumors (gse49710). (B) Gene set enrichment analysis plots showing genes sets with similar pattern of regulation in kalirin–GEF1–inhibited and DCX-KD IMR-32. (C) Venn diagram showing the number of genes in transcriptomic overlap between DEGs in RAC1 inhibitor-, kalirin–GEF1 inhibitor#1– and kalirin–GEF1 inhibitor#2–treated IMR-32 versus control. (D) Box plots demonstrating ZNF702P, SIAH1, and KIF6 expression in primary NB tumors. (E) Color-coded scheme showing gene overlaps between 3′-UTR- and intronic-AU–rich element (ARE)-containing genes (Bakheet et al, 2018) in the ranked lists of DEGs in RAC1- and kalirin–GEF1–inhibited IMR-32 versus control IMR-32. (F) Enrichment plots for miR-573 targets (“miR-573_PITA”) based on PITA algorithm (Kertesz et al, 2007) in IMR-32–treated with kalirin–GEF1 inhibitor#1 versus control (top). Diagrams demonstrating miR-573 targets in the ranked gene subsets of 3′-UTR-ARE and intronic ARE containing genes from IMR-32–treated with kalirin–GEF1 inhibitor#1 versus control (bottom). (G) Box plot demonstrating MIR573 expression in primary NB tumors (gse62564) (left) and volcano plot showing expression of predicted miR-573 targets (right) in stage 4S versus 4 tumors. (H) Box plot showing distances between AREs and miR-573–binding sites in 3′-UTRs of DEGs in kalirin–GEF1–inhibited cells. P-value: 0.005 (two-sample Kolmogorov–Smirnov test). (I) Gene set enrichment analysis plots for the indicated gene sets (top) in the combined list of genes mis-regulated (based on their mis-expression in stage 4S versus stage 4 tumors [P-values by two-way t test ≤0.05; no logFC cutoff]) in RAC1- and kalirin–GEF1–inhibited IMR-32. Color-coded scheme showing gene overlaps (bottom) between mis-expressed genes extracted from profiles of kalirin–GEF1– and RAC1-inhibited cells and ranked according to their expression in stage 4S versus stage 4. (J) Diagrams showing positions of the genes up-regulated by dacarbazine in ADRN-type cell lines (Henrich et al, 2016) in the combined lists of genes mis-regulated in RAC1– and kalirin–GEF1–inhibited (top) and DCX-KD IMR-32 (bottom).

