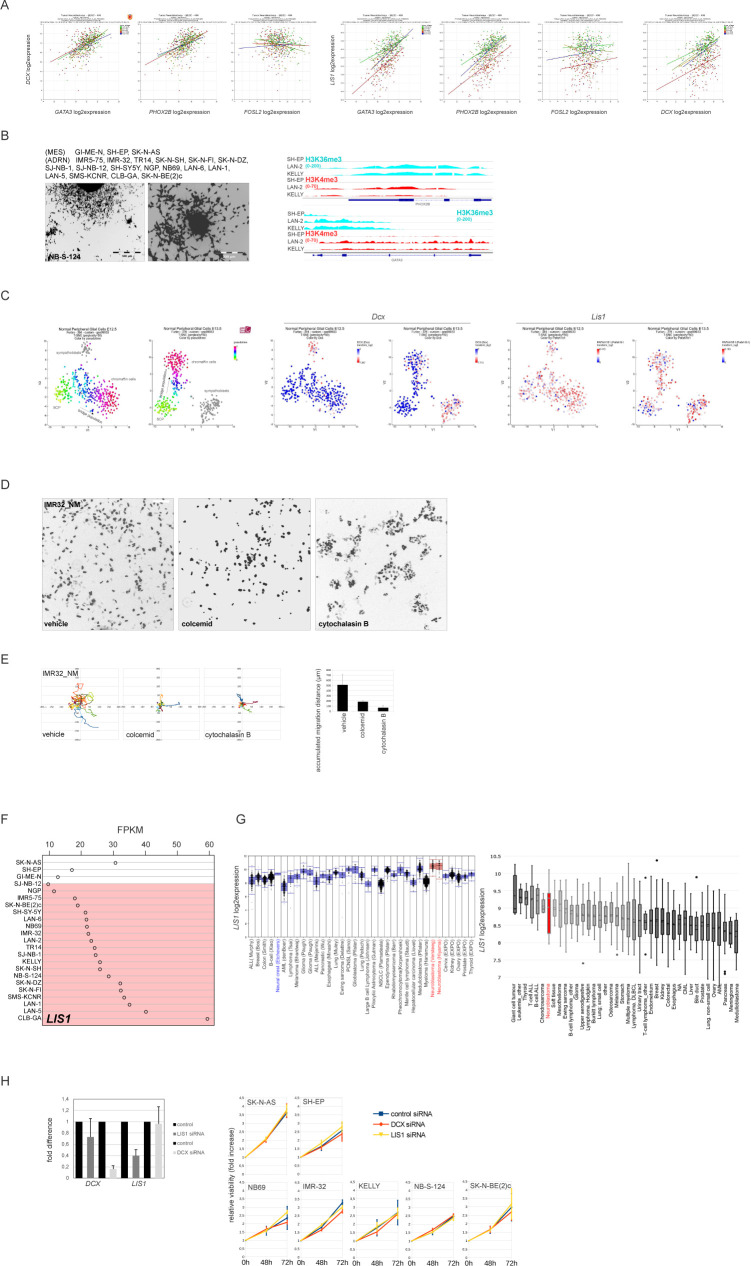
Figure S1. Expression of NUC genes, DCX, and LIS1, in NB.
(A) Scatter plots showing correlation of expression of DCX or LIS1 and ADRN transcription factors GATA3, PHOX2B, or MES transcription factor FOSL2 (498 patients; GEO: gse49710). (B) ADRN and MES cell lines used in the work (Boeva et al, 2017; van Groningen et al, 2017) (top left) and representative phase-contrast images of N-type NB-S-124 (bottom left). ChIP-seq (right) showing H3K4me3 and H3K36me3 binding at GATA3 and PHOX2B loci in I-type cell lines KELLY and LAN-2 and MES-type SH-EP. (C) Dcx and Lis1 expression in t-SNE-resolved E12.5 and E13.5 sympathetic precursors: sympathoblasts, Schwann cell precursors, bridge population, and chromaffin cells (Furlan et al, 2017). t-SNE maps are annotated according to Furlan et al (2017). (D)_NM fluorescence (negative grayscale) for nuclear morphologies in IMR-32_NM cells after treatment with vehicle, colcemid or cytochalasin b. Scale bar 100 μm. (E) Random walk plots and accumulated migration distances in vehicle, colcemid or cytochalasin B-treated IMR-32_NM (13 h, 15-min intervals). For colcemid experiments, the cells were washed after treatment and left to recover for 10 h before imaging. Cells were tracked using an ImageJ plugin for manual tracking. Mean migration distances + SD are presented. (F) LIS1 mRNA expression in MES and ADRN (marked in red) cell lines. (G) Affymetrix LIS1 mRNA expression analysis (left) in two series of NB tumor samples (red) and series of various other tumor types and neural crest cell line (blue) (probe set 229349). Affymetrix LIS1 mRNA expression data (right) from various cancer cell lines (CCLE). NB cell lines are indicated in red. (H) Validation of DCX and LIS1-KD (left) by qRT-PCR 48 h after transfection in IMR-32 and cell viability of NB cell lines after DCX or LIS1-KD (right). Cell survival was assessed by Alamar Blue assay at 48 and 72 h after transfection. Values are reported as mean percent ± SD of vehicle-treated control.

