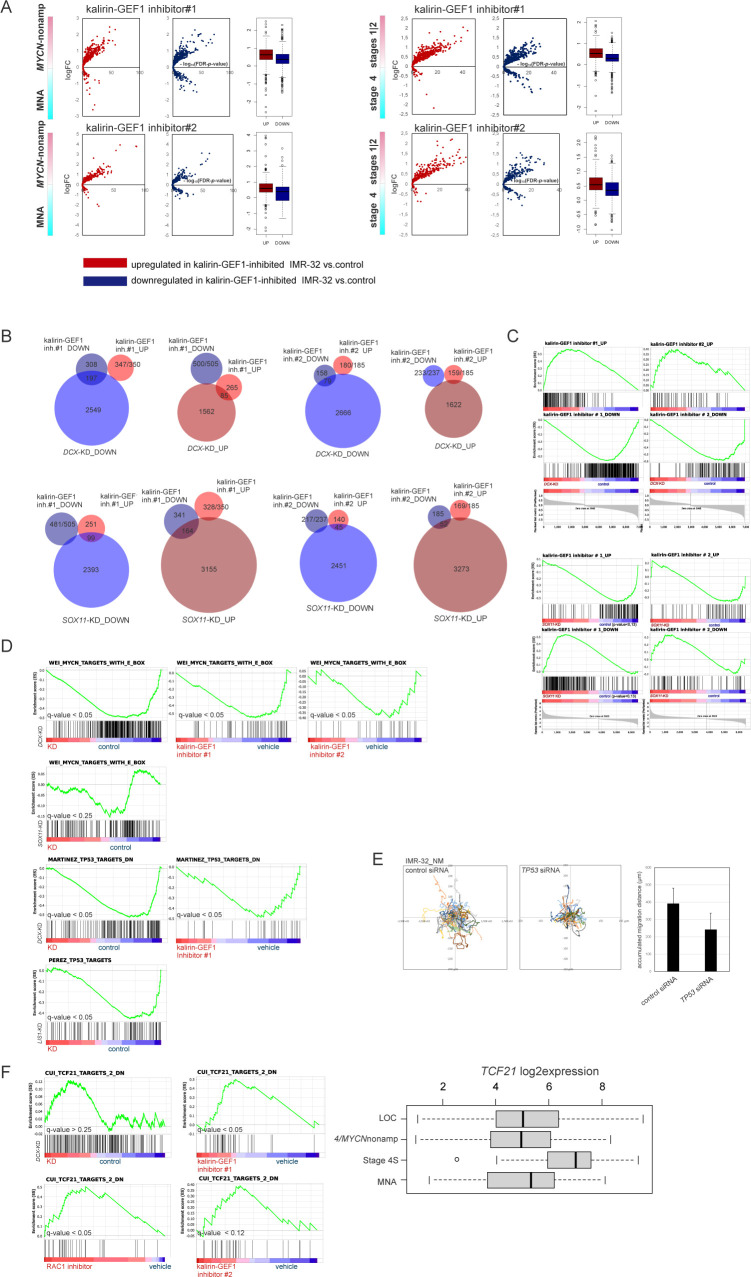
Figure S10. Analysis of DEGs in kalirin-GEF1-inhibited IMR-32.
(A) Volcano plots showing expression of DEGs in kalirin–GEF1–inhibited IMR-32 versus control IMR-32 in MYCN-nonamplified versus MNA and stages 1|2 versus 4 tumors. (B) Venn diagrams showing the numbers of genes in transcriptomic overlap between kalirin–GEF1 inhibition and DCX-KD or SOX11-KD in IMR-32. (C) Enrichment plots showing positions of DCX-KD and SOX11-KD transcriptomic overlaps in kalirin-GEF1-inhibited IMR32 versus control IMR-32. (D) Enrichment plots showing TP53 and MYC(N) targets in DCX-KD, RAC1-inhibited/kalirin-GEF1 LIS1-KD, SOX11-KD, and IMR-32 versus control. q-values are listed. (E) Random walk plots and accumulated migration distances in control IMR-32_NM cell after 48 h of TP53 RNAi (4 h, 5-min intervals). Mean values + SD are presented. P-value: 0.003 (Welch t test). (F) Enrichment plots showing “CUI_TCF21_TARGETS_DN“ gene set (left) in DCX-KD, RAC1-, and kalirin–GEF1–inhibited cells and box plot demonstrating TCF21 expression in primary NB tumors (right).

