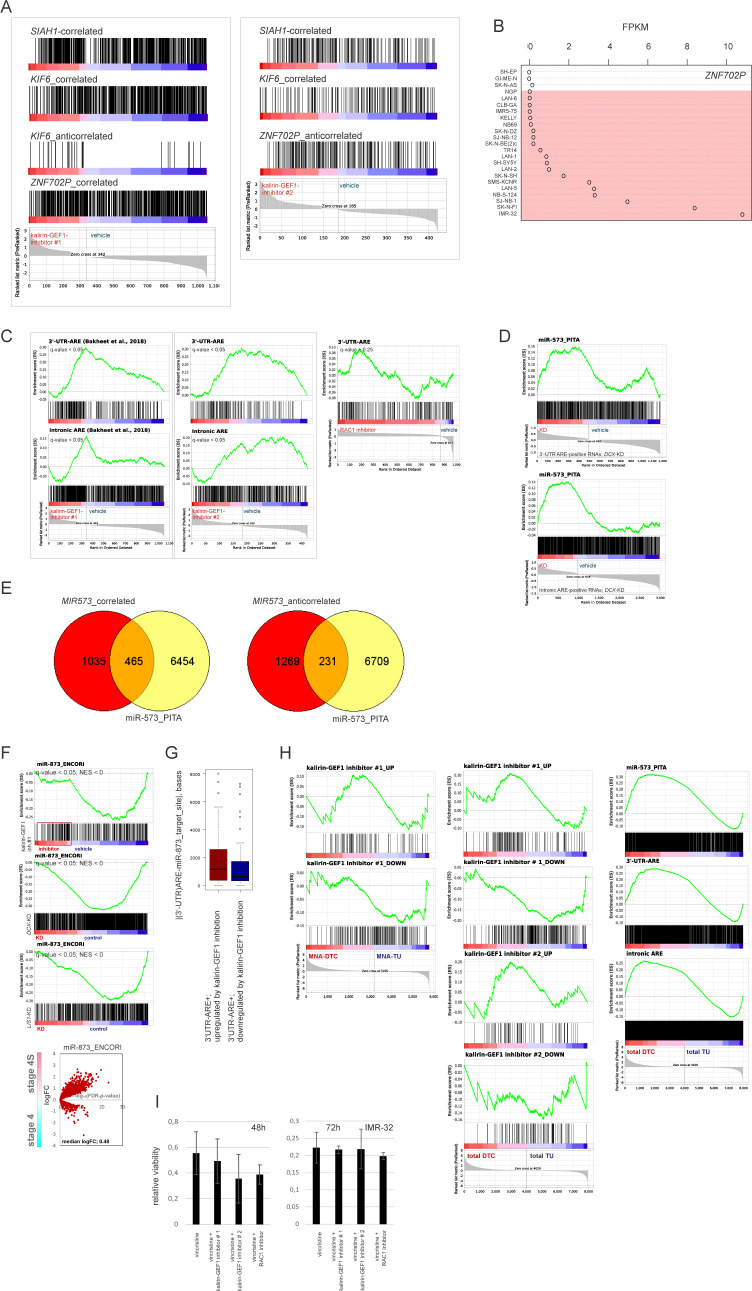
Figure S11. Analysis of AU-rich element (ARE)–containing genes and miRNA targets in kalirin-GEF1– and RAC1-inhibited IMR-32.
(A) Diagrams showing positions of genes correlated positively or negatively with ZNF702P, SIAH1 and KIF6 expression in kalirin–GEF1–inhibited IMR-32 versus control IMR-32. (B) ZNF702P mRNA expression in MES and ADRN (marked in red) cell lines. (C) Enrichment plots for ARE-containing genes (Bakheet et al, 2018) in kalirin-GEF1- and RAC1-inhibited IMR-32 versus control IMR-32 (q-values are listed). (D) Enrichment plots for miR-573 targets (Kertesz et al, 2007) in the ranked gene subsets of 3′-UTR-ARE and intronic ARE containing genes from DCX-KD IMR-32 versus control IMR-32 (q-values are listed). (E) Venn diagrams showing the number of genes potentially targeted by miR-573 (Kertesz et al, 2007) in the subsets of genes correlated positively (“correlated”) and negatively (“anticorrelated”) with the expression of MIR573 in primary NB (gse62564). (F) Enrichment plots for the genes targeted by miR-873 (Li et al, 2014) in kalirin-GEF1-inhibitor#1-treated, DCX-KD and LIS1-KD IMR-32 versus control (q-values are listed) (top) and volcano plot showing expression of miR-873 targets (bottom) in stage 4S versus 4 tumors. (G) Box plots showing distances between AREs and miR-873 target sites in 3-UTRs of DEGs in kalirin–GEF1–inhibited cells. P-value: 0.04 (two-sample Kolmogorov–Smirnov test). (H) Mapping of DEGs in kalirin–GEF1–inhibitor#1- and kalirin–GEF1–inhibitor#2-treated IMR-32 (left) and miR-573 targets and ARE-containing genes (right) onto NB_disseminated tumor cell transcriptomic profiles. (I) Cell viability in RAC1-inhibited and kalirin–GEF1–inhibited IMR-32 treated with vincristine. Mean relative viabilities + SD are presented.

