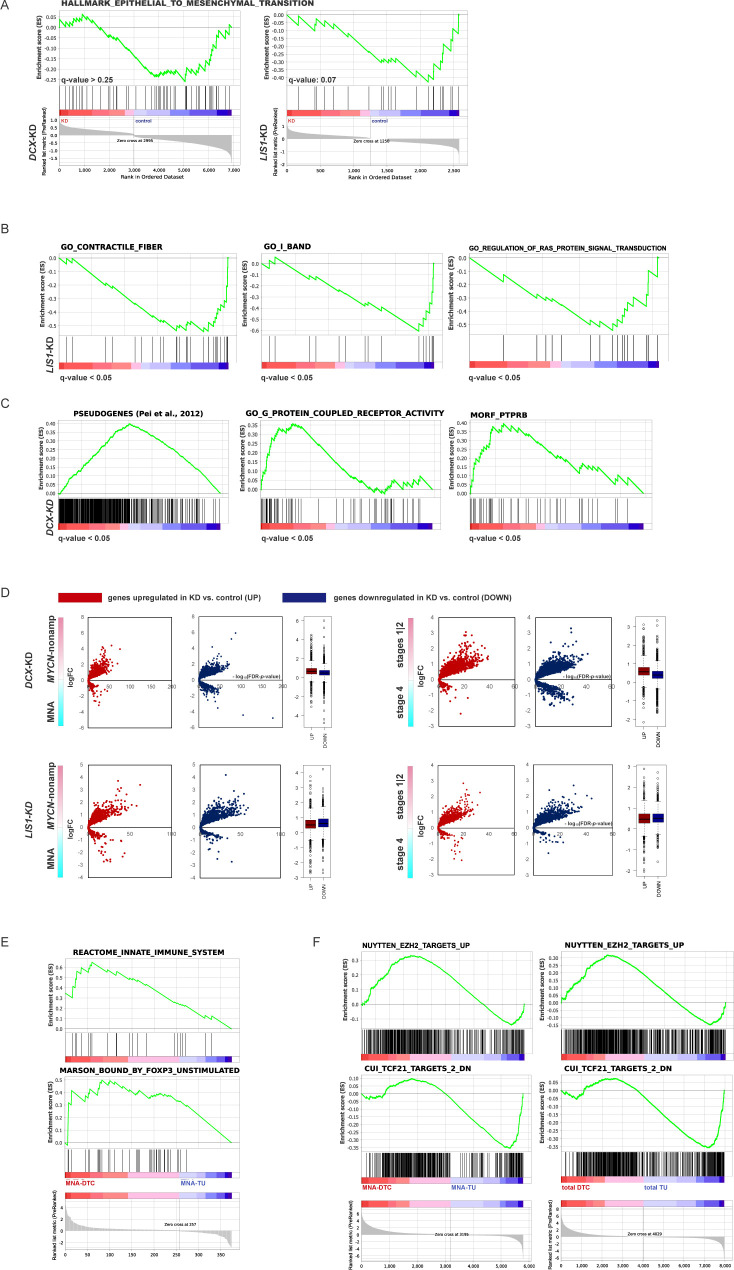
Figure S2. Analysis of DEGs in DCX- and LIS1-KD IMR-32.
(A) Gene set enrichment analysis (GSEA) plots showing gene set “epithelial–mesenchymal transition” in DCX- and LIS1-KD IMR-32 versus control. q-values are listed. (B) GSEA plots showing gene signatures related to cell contraction and Ras signalling regulation in LIS1-KD IMR-32 versus control IMR-32. q-values are listed. (C) Enrichment plots for pseudogene transcripts (Pei et al, 2012), gene signatures related to G-protein coupled receptor signalling and PTPRB neighbourhood in DCX-KD IMR-32 versus control IMR-32. q-values are listed. (D) Volcano plots showing expression of DEGs in DCX-KD and LIS1-KD cells in MYCN-nonamplified versus MNA and stages 1|2 versus stage 4 tumors. (E) GSEA plots for immune cell specific signatures of DCX-KDUP ∩ NB_disseminated tumor cell list. (F) GSEA plots for the signatures associated with stage 4S, stages 1|2 and MYCN-nonamplified status, as identified by parametric analysis of gene set enrichment (PAGE analysis) using gse49710 signature (Table S1) in NB disseminated tumor cell transcriptome profiles (Rifatbegovic et al, 2018).

