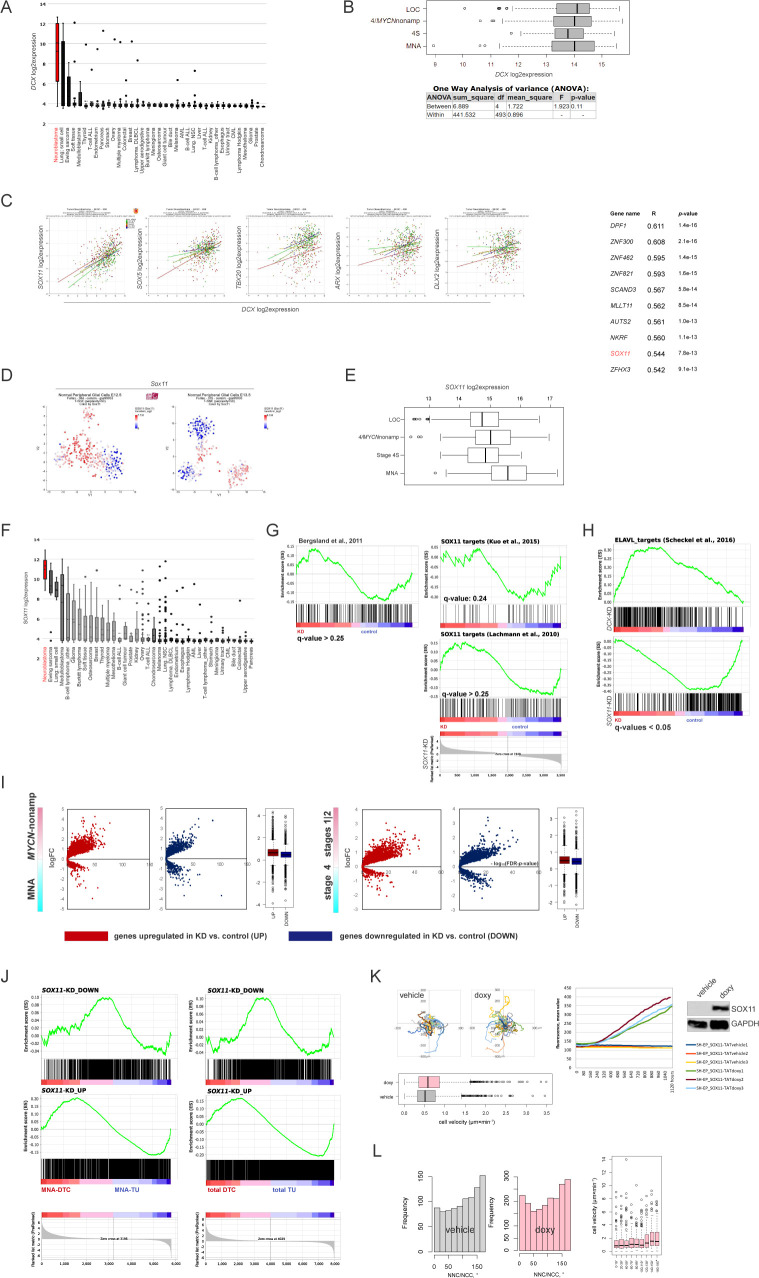
Figure S3. Modulation of SOX11 levels in ADRN and MES NB cell lines.
(A) Affymetrix DCX mRNA expression analysis in cancer cell lines. (B) Box plots demonstrating DCX expression in primary NB: MYCN-nonamplified (stages 1–3 [localised, LOC], stage 4, stage 4S) and MNA (gse49710) and P-values by one-way ANOVA analysis. (C) Scatter plots (left) showing correlation of expression of DCX mRNA and the transcription factors involved in neuronal migration (gse49710) and Top10 of transcription factors positively correlated with DCX mRNA (right) in stage 4 NB (gse49710). (D) Sox11 expression in t-SNE-resolved E12.5 and E13.5 sympathetic precursors: sympathoblasts, Schwann cell precursors, bridge population and chromaffin cells (Furlan et al, 2017). Population annotation is as described in Fig S1C. (E) Box plot demonstrating SOX11 mRNA expression in primary NB (gse49710): MYCN-nonamplified (LOC, stage 4, and stage 4S) and MNA. (F) Affymetrix SOX11 mRNA expression analysis in various cancer lines. (G) Gene set enrichment analysis plots showing humanized gene list of Sox11 bound genes (Bergsland et al, 2011) and SOX11 targets (Lachmann et al, 2010; Kuo et al, 2015) in SOX11-KD versus control. (H) Gene set enrichment analysis plots showing targets of ELAVL proteins (Scheckel et al, 2016) in SOX11-KD, DCX-KD IMR-32 versus control. (I) Volcano plots showing expression of DEGs in SOX11-KD IMR-32 in MYCN-nonamplified versus MNA and stages 1|2 versus stage 4 tumors. (J) Mapping plots of DEGs in SOX11-KD IMR-32 onto NB disseminated tumor cell transcriptome profiles (Rifatbegovic et al, 2018). (K) Random walk plots in SH-EP_SOX11-TAT (top left) after application of doxycycline (doxy) or vehicle (1 h of pretreatment + 6 h 30 min of tracking, 15-min intervals) and box plots demonstrating cell velocity (bottom left) in vehicle (n = 2,065) and doxy-induced (n = 2,112) SH-EP_SOX11-TAT. P-value: 2.2 × 10⁻¹⁶ (Kruskal-Wallis test). SOX11 overexpression was confirmed by fluorescence monitoring and WB (right, exemplary tracks from three experiments). (L) NNC/NCC angle frequency distribution in concatenated tracks from control (22 cells; 923 timepoints) and doxycycline-induced (106 cells; 1,904 timepoints) SH-EP_SOX11-TAT (left). Box plots showing cell velocities (right) across NNC/NCC angle frequency distribution in SH-EP_SOX11-TAT.

