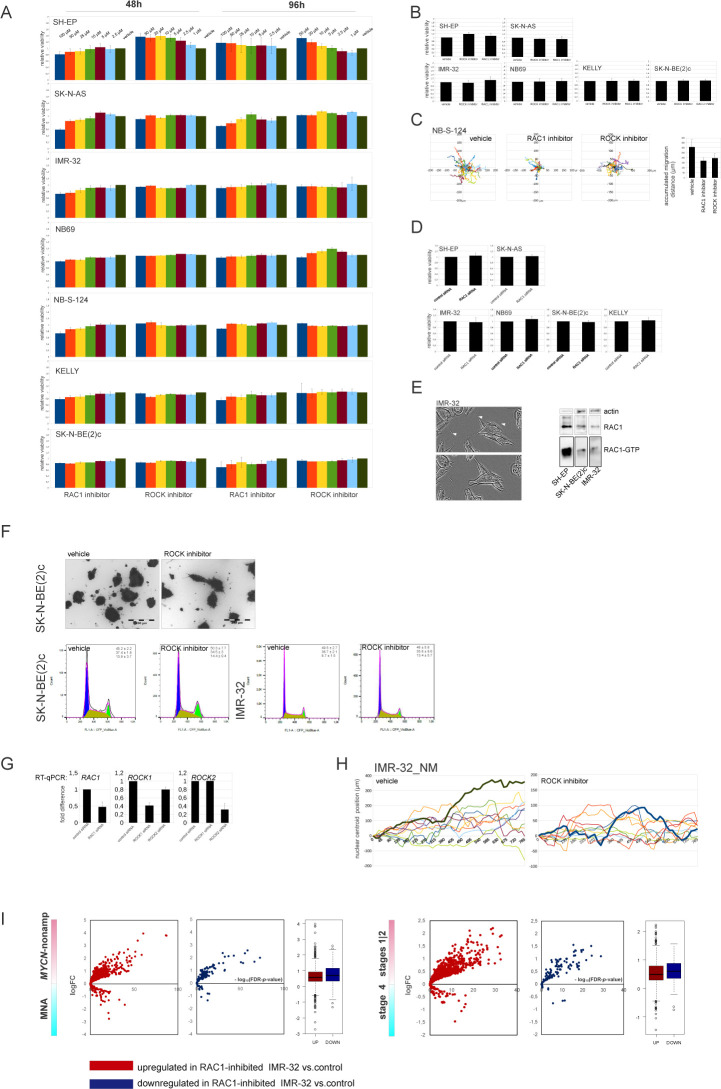
Figure S4. Cell analyses in NB cell lines after RAC1 and ROCK inhibition.
(A) Cell viability of NB cell lines treated with various concentrations of RAC1 inhibitor NSC23766 or ROCK inhibitor Y27632. Cell survival was assessed by Alamar Blue assay at 48 and 96 h after treatment. Mean percent values ± SD of vehicle-treated control are reported. (B) Cell viability of NB cell lines treated with ROCK inhibitor Y27632 (5 μM) or RAC1 inhibitor NSC23766 (10 μM) in 2D exclusion assay. Cell survival was assessed by Alamar Blue assay. Mean percent values + SD of vehicle-treated control are reported. (C) Random walk plots and accumulated migration distances of vehicle, RAC1 inhibitor- and ROCK inhibitor-treated NB-S-124 cells (2.5 h; 5-min intervals). (D) Cell viability of NB cell lines transfected with control siRNA or RAC1 siRNA in 2D exclusion assay. Cell survival was assessed by Alamar Blue assay. Mean percent values + SD of control are reported. (E) Representative images of IMR-32 showing filopodia and growth cone-free cell edges (left). Scale bar 20 μm. RAC1 activity in IMR-32, SK-N-BE(2)c and SH-EP (right). The cell lysates were incubated with PAK-PBD beads and the bound RAC1 was analysed by Western blotting. (F) Images of SK-N-BE(2)c spheroids stained with Calcein AM after 72 h of treatment with vehicle or ROCK inhibitor in pseudo 3-D. Cell cycle analysis by flow cytometry in SK-N-BE(2)c and SK-N-BE(2)c after the treatment with ROCK inhibitor. Cell cycle distribution of VioBlue Dye-labelled cells was analysed by flow cytometric analysis. Percentage of cells in each phase of the cell cycle and representative cell cycle images are shown. Mean values ± SD are presented. (G) qRT-PCR analysis of RAC1-, ROCK1- and ROCK2-KD in IMR-32 cells. (H) Tracings of IMR-32_NM nuclei after treatment with vehicle and ROCK inhibitor. (I) Volcano plots showing expression of DEGs in RAC1-inhibitor-treated IMR-32 in MYCN-nonamplified versus MNA and stages 1|2 versus stage 4 tumors.

