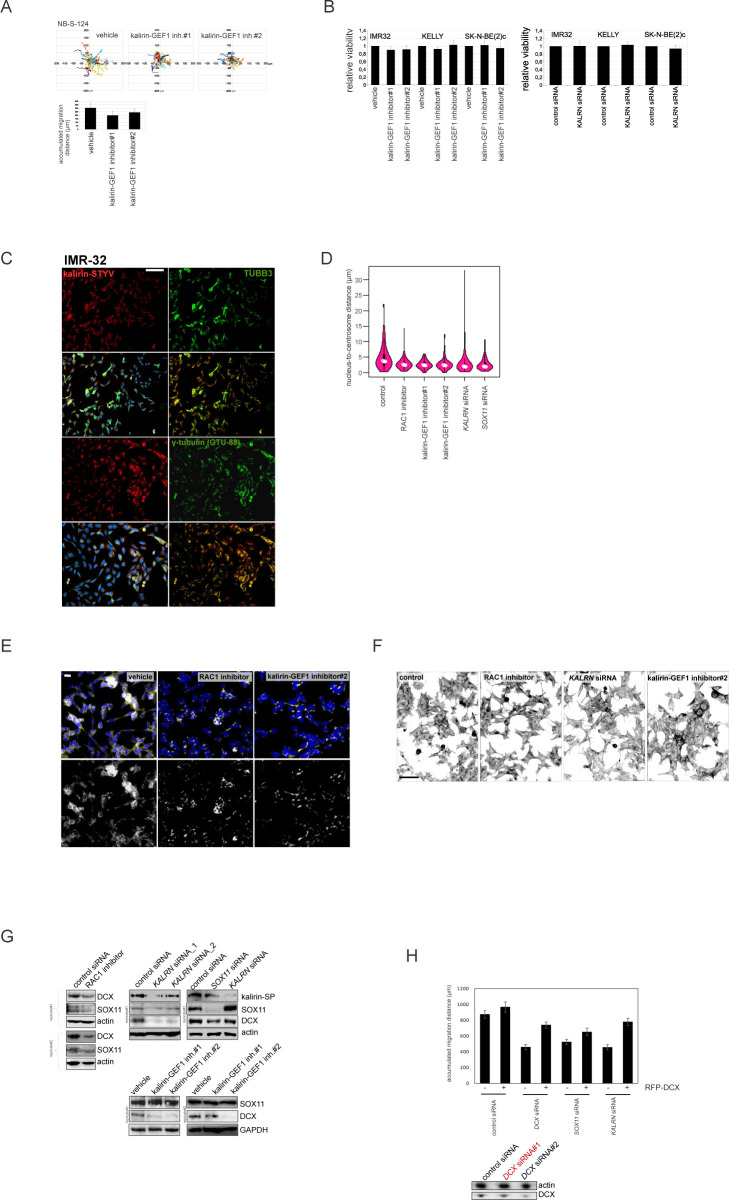
Figure S8. Analysis of NUC defects in kalirin-GEF1-inhibited cells.
. (A) Random walk plots and accumulated migration distances of vehicle- and kalirin–GEF1 inhibitor–treated NB-S-124 cells (13 h, 15-min intervals). Mean values + SD are presented. (B) Cell viability of NB cell lines treated with vehicle, kalirin–GEF1 inhibitor#2 (5 μM) or kalirin–GEF1 inhibitor#1 (10 μM) in 2D exclusion assay. Values are reported as mean percent + SD of vehicle-treated control. (C) Kalirin–STYV, βIII-tubulin, and γ-tubulin co-localisation in IMR-32. (D) Violin plots showing the nucleus-to-centrosome distance in IMR-32 cells treated with kalirin–GEF1 inhibitor#1, kalirin–GEF1 inhibitor#2, or RAC1 inhibitor and in KALRN-KD or SOX11-KD IMR-32 cells. P-values: RAC1 inh: 0.0001028, kalirin–GEF1 inhibitor#1: 1.933 × 10⁻⁶, kalirin-GEF1 inhibitor#2: 1.191 × 10⁻⁵, KALRN siRNA: 0.0001527, SOX11 siRNA; 2.388 × 10⁻⁵ (Welch t test). (E) γ-tubulin distribution in control, RAC1 inhibitor–treated and kalirin–GEF1 inhibitor#2–treated IMR-32 cells. Scale bar 20 μm. (F) Representative negative images of IMR-32 in control cells and after treatment with RAC1 inhibitor, kalirin–GEF1 inhibitor#2 or after KALRN-KD stained with phalloidin-Alexa Fluor-555. Scale bar 200 μm. (G) WB for DCX in RAC1-inhibited and kalirin-GEF1-suppressed IMR-32. (H) Cell migration (16 h, 15-min intervals) in expressing DCX-RFP KALRN-KD, SOX11-KD and DCX-KD (Ambion siRNA:145587) IMR-32 cells (72 h of RNAi). Values are reported as mean + SE of control. P-values: (DCX-RFP [−] versus DCX-RFP [+]): control siRNA: n.s., DCX siRNA: 9.906 × 10⁻⁷; SOX11 siRNA: 0.1; KALRN siRNA: 3.737 × 10⁻⁷ (Welch t test). The efficiency of DCX-KD was determined by WB, and the selected siRNA is marked in red.

