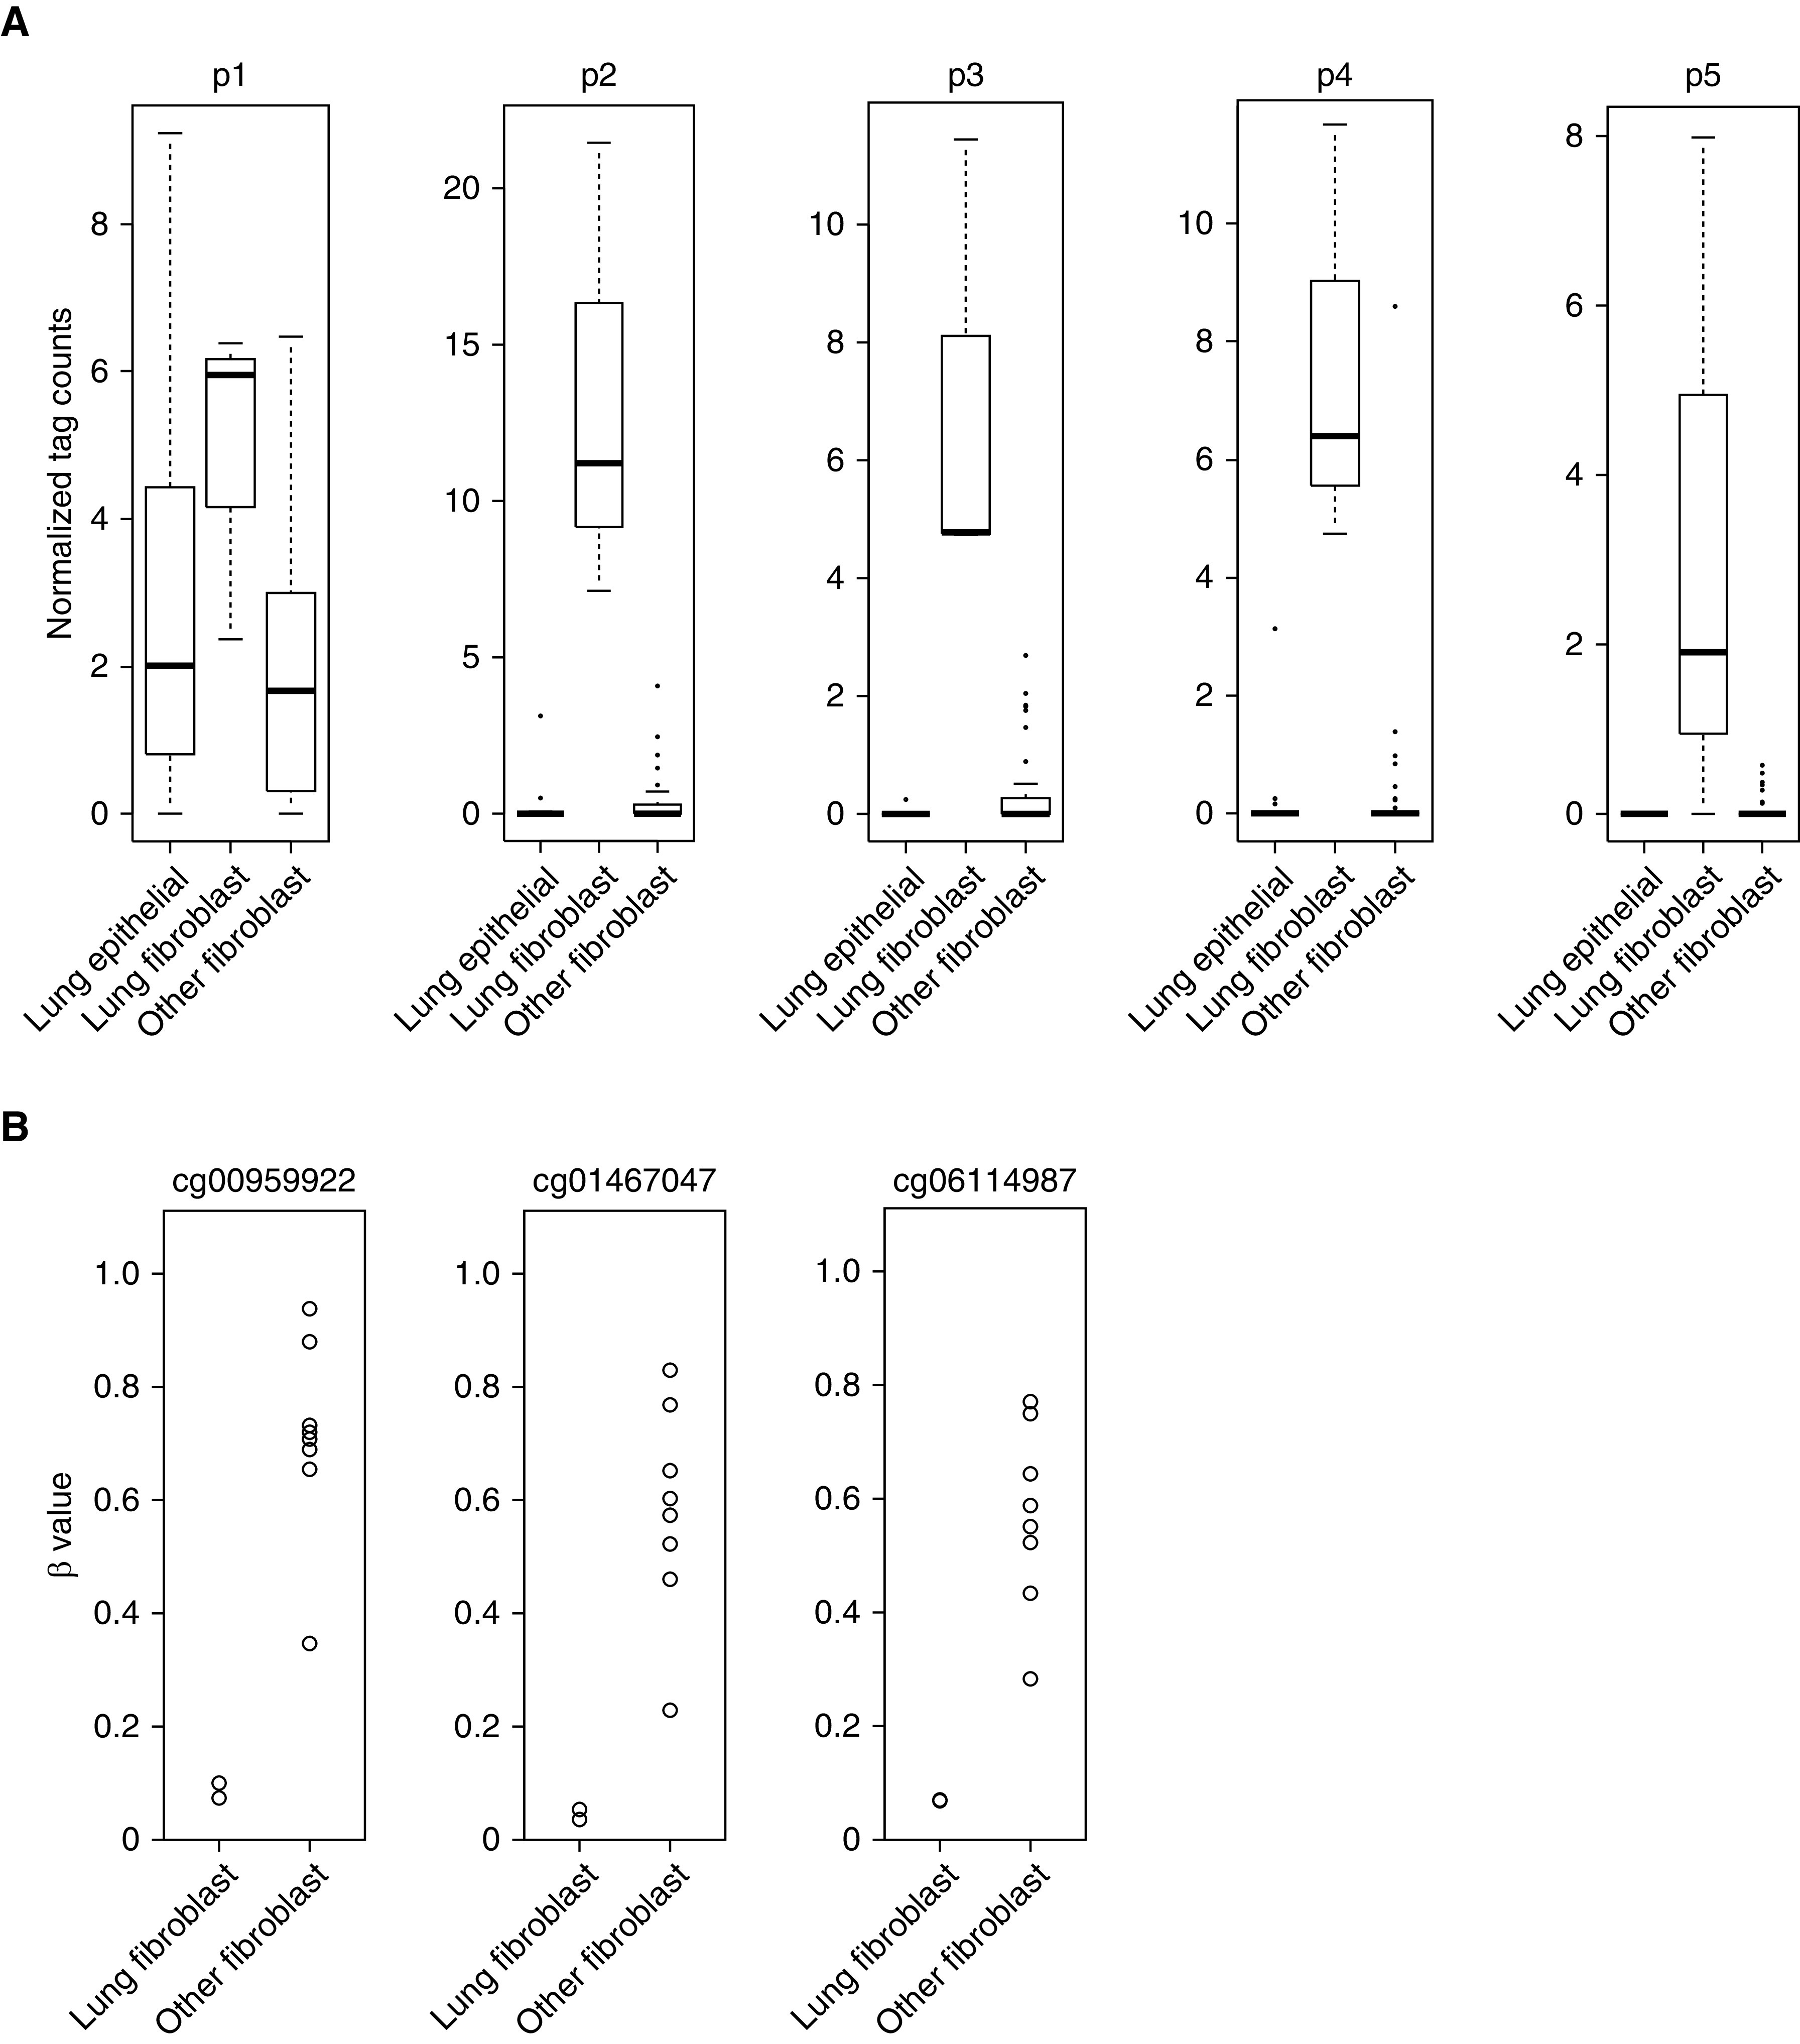
Figure 1.

Higher expression of FOXL1 (forkhead box L1) in lung fibroblasts. (A) Box plot showing normalized cap analysis of gene expression (CAGE) tag counts of p1, p2, p3, p4, and p5 promoters annotated to FOXL1. CAGE data were compared among the following three groups: 16 lung epithelial cell lines (alveolar, small airway, bronchial, and tracheal epithelial cells), three lung fibroblast lines, and 42 other fibroblast lines that included gingival fibroblasts (n = 6), periodontal ligament fibroblasts (n = 6), cardiac fibroblasts (n = 6), choroid plexus fibroblasts (n = 3), conjunctival fibroblasts (n = 2), dermal fibroblasts (n = 6), aortic adventitial fibroblasts (n = 3), lymphatic fibroblasts (n = 3), mammary fibroblasts (n = 3), pulmonary artery fibroblast (n = 1), and villous mesenchymal fibroblasts (n = 3). The central line in the box indicates the median value. (B) DNA methylation levels shown as β values (the GSE40699 dataset) were compared between lung fibroblast lines (n = 2) and other fibroblast lines (n = 8). CpG sites located upstream from the transcription start site (TSS) are indicated (cg00959922, cg01467047, and cg06114987).
